Tag: analysis

  • Enter Johaug?

    Lots of racing this weekend, obviously, but the Muonio results only appeared on the FIS website today, so they’ll wait for later in the week. I was intrigued, though, but Therese Johaug’s strong races in Norway.

    For many reasons, it will be difficult to accurately parse early season results this year. Many people are focused on mid-season events like the Tour de Ski and World Championships, so it’s hard to say what kind of shape everyone is in now. However, I think it was interesting that Johaug beat Bjoergen twice this weekend.

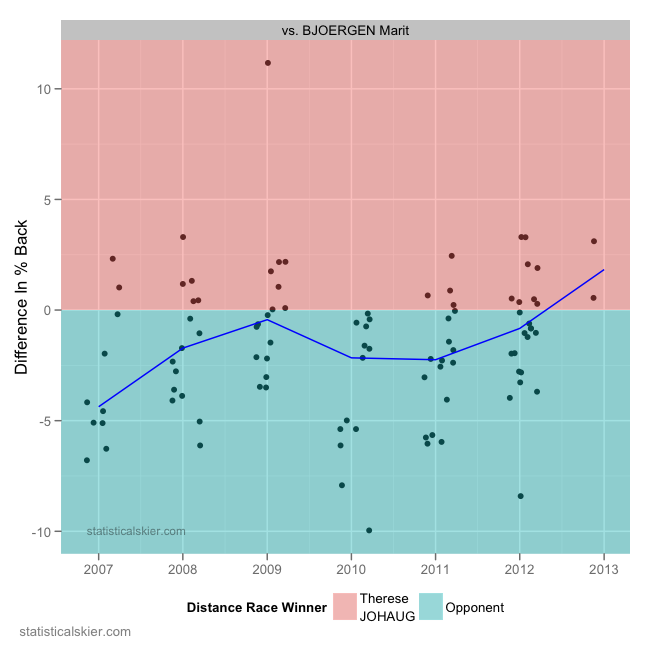
    How does that look compared to how the two have fared against each other over the long term?

    Up in this graph is better for Johaug. As we can see, both victories were good races (clearly) but not radically out of character. Johaug racked up a fair number of wins against Bjoergen last season, and the trajectory has been swinging in her direction. Will that continue this season? We shall see…

    Related posts:

    1. <Head-to-Head: Marit vs Justyna
    2. <La Clusaz Recap: Distance Mass Start
    3. <Nicole Fessel Update


  • First WC vs Performance

    Continuing with the athlete development theme recently, here’s a graph showing the age at which a skier races in their first WC versus their overall median WC result:

    For fairly obvious reasons, you have read this fairly carefully, particularly at the more extreme ages. I wouldn’t pay much attention to either panel past the age of 30, simply due to sample size.

    What I find interesting about this is that for the men, at least, it reinforces the idea that 25 is really the maximum age at which you want to be cutting your teeth on the WC circuit. The relationship for the women is more stable, indicating an interesting contrast between the genders. It seems that it’s at least more likely for women to start late and not perform (on average, across all skiers) significantly worse than folks who started on the WC at a fairly young age. I want to emphasize that that’s a relative conclusion, i.e. that we’re simply saying that the women are more likely to see that happen than the men, rather than saying the women are generally likely to start late and perform really well.

    Related posts:

    1. <Skiing Performance and Age
    2. <Performance Trends: ITA, FIN, GER
    3. <Yet Another Athlete Development Marker


  • Domestic Podium Development

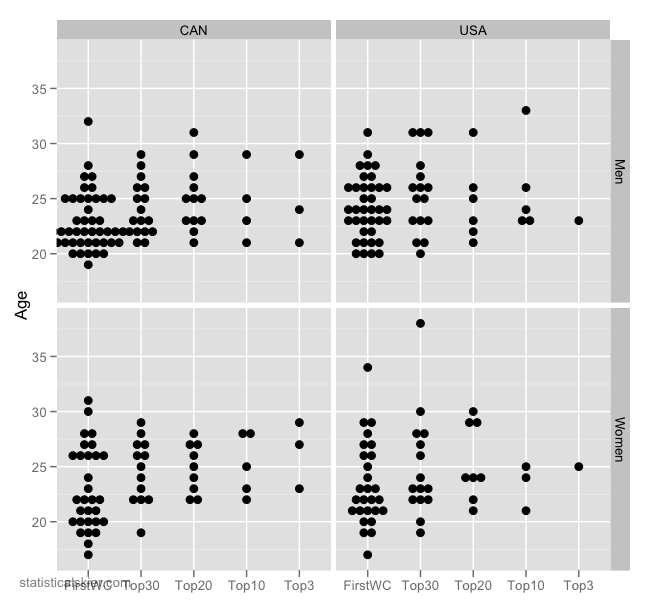
    I got a request for some similar graphs from my podium development posts, but focused more on the domestic scene. So, for example, we had this graph:

    This showed the age at which future WC podium finishers achieved a particular milestone. So let’s turn to just US and Canadian skiers who have simply participated in a WC over roughly the same time span and make a similar graph, with a slightly expanded set of milestones:

    Sprint and distance have all been lumped together here. The only thing I’m going to point out with this is the rather dramatic age difference for the skier’s first WC start. Note how for the international podium winners, it is virtually unheard of for them to have cut their teeth on the WC after the age of 25. Now look at the domestic graph; many more of our WC athletes are getting their first taste of WC action at a very late age.

    It’s important, as always, not to confuse cause and effect here. Dumping skiers into a WC at the age of 21 won’t magically turn them into podium material. (But it might not hurt…) A more plausible explanation might be that other countries are doing a systematically better job at developing athletes faster, such that they are at the right stage of their development for a first WC start at a significantly earlier age.

    Related posts:

    1. <Post-WJC/U23 Development: Canada
    2. <Yet Another Athlete Development Marker
    3. <Development Questions


  • Alpine World Cup – Soelden

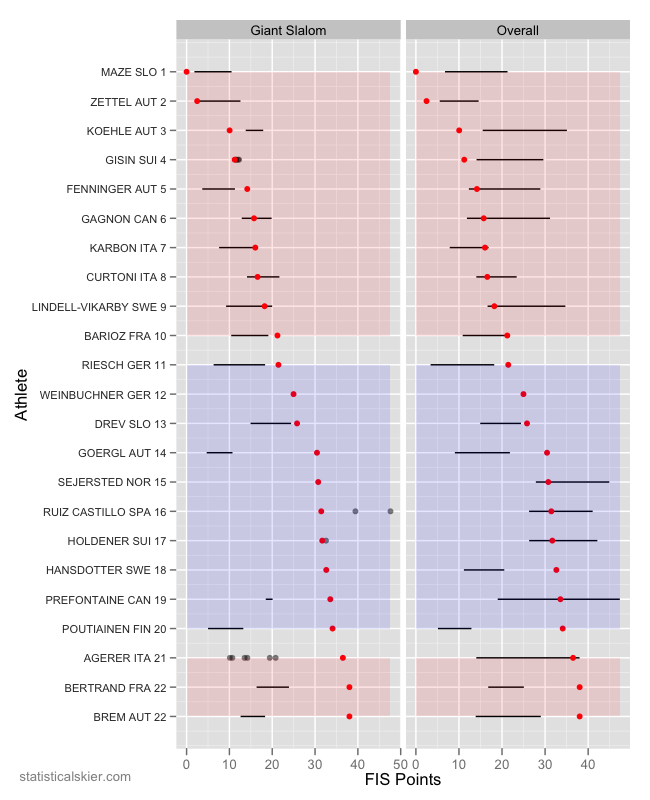
    Just following up from Tuesday with the race snapshot graph for the women’s GS race on Saturday:

    Related posts:

    1. <Race Snapshot: IBU World Cup 1 Women
    2. <Race Snapshots: IBU World Cup 1 Men
    3. <World Cup Field Strength Follow-Up


  • Moosilauke – Full History

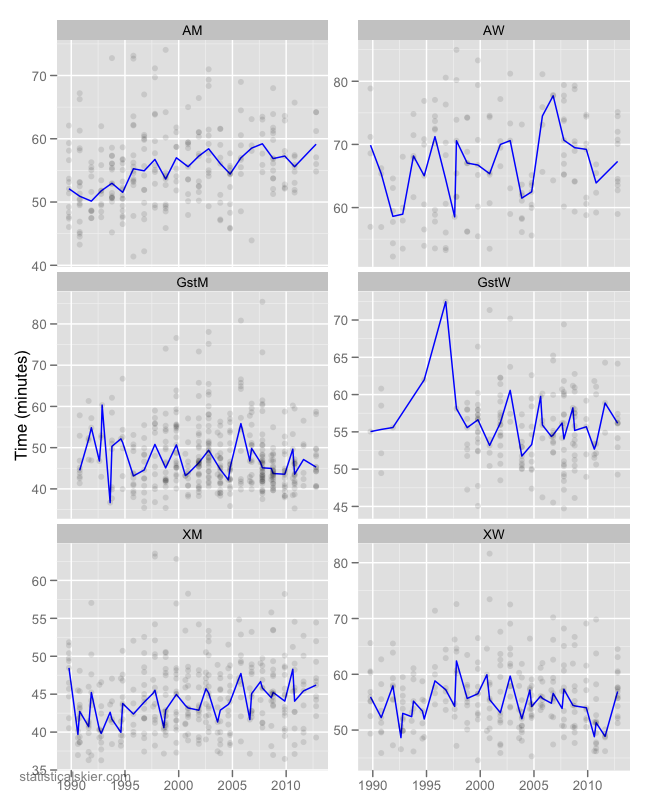
    After correcting a few typos in the the “official” results I thought we’d look again at the time histories for Dartmouth’s Moosilauke time trial. The following graph depicts every result (except for 2011, which I still can’t find anywhere).

    The blue is the median for each individual running; this includes both summer and fall times. Despite some course changes over time, it’s interesting that you probably wouldn’t be able to spot exactly when they happened from the graphs. There’s just a bit too much noise in there.

    The cross country men (i.e. men actual on the Dartmouth Ski Team) have, on average actually been getting slower, in an absolute sense. But definitely the strongest trend is in the alpine men. Course changes aside, it would be interesting to look up who was on the alpine men’s team at Dartmouth in the early 90′s.

    Related posts:

    1. <Aging Ski Teams: Poland and Germany
    2. <Moosilauke Time Trial
    3. <Animated WJC Results History


  • Moosilauke Time Trial – Fall 2012

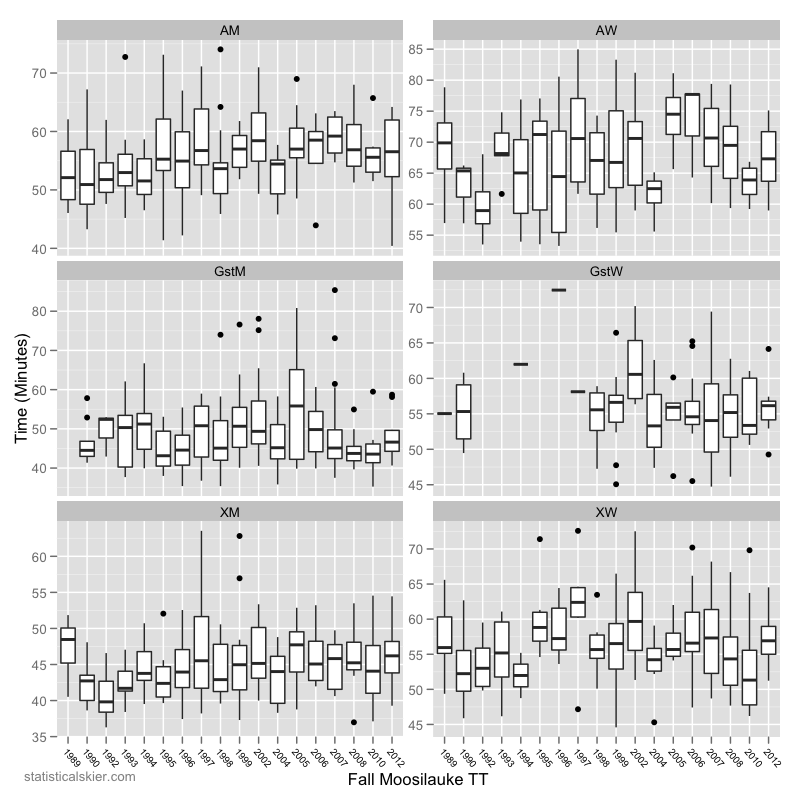
    As FasterSkier mentioned the other day, the Dartmouth Ski Team’s Moosilauke time trial is a pretty neat data set, since they’ve kept the data going back quite a ways. Interpretations are sometimes a challenge, since the course has changed from time to time when trail work is done. My sources tell me that in addition to the weather being horrendous this year the trail was slightly rerouted, possibly adding some distance to the course.

    Given all this, the times were a bit slow (click for full version):

    Those are only the fall term runnings, and 2011 is missing, since those times appear to be missing on the official historical results.

    Related posts:

    1. <Moosilauke Time Trial
    2. <USST 2011-2012 Preview
    3. <Canadian Ski Team: 2011-2012 Preview


  • Best Season Ever: Distance

    Well, ok, not ever.  Just over the past 20 seasons or so.

    There are all sorts of different ways we could measure this.  First, some ground rules: I’m only going to look at actual World Cup races, no Olympics or World Championships.  I’m also excluding Tour de Ski events because these are my rules, so I get to make them up.  Seriously, though, I think Olympic and World Championship races should count differently (i.e. more), so later on I’ll redo this but in a weighted fashion.

    I’m not going to just single out a skier’s top five races, either.  If you’re going be considered for a “best season ever” prize, we’re not going to ignore a handful bad races!  Also, you must to have done at least 5 races for your season to count.

    I’m going to use three different measures: average FIS points, average finishing place and the proportion of victories.  Generally, they all track each other nearly identically, so the point isn’t to compare/contrast between them.  Rather, having all three gives us a fuller picture of each season.

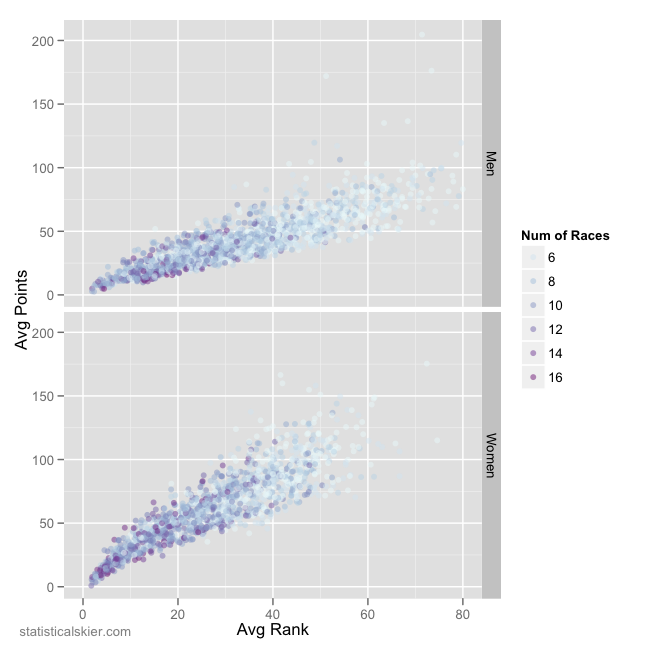
    First let’s look at data for everyone:
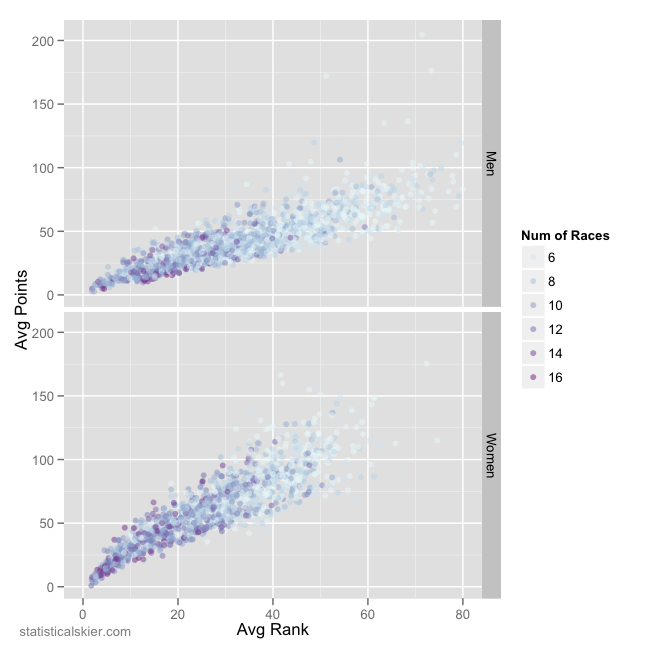
    That’s everyone in my database over 19 seasons, every season with at least 5 starts.  As you can see, average rank and average FIS points track each other pretty well.  Interestingly, the people with the worst seasons are the ones with the fewest number of races, in general.  This probably just reflects the fact that if you aren’t getting more than 5-6 WC starts in a season, chances are it’s because you actually aren’t terribly fast.  There are exceptions, of course.

    Let’s focus in on the top ten seasons for men and women, as ranked by average FIS points (the ranking hardly changes at all if you use average finishing place).

    Name Nation Season Avg Rank Avg Points Win Pct Num of Races
    ELOFSSON Per SWE 2000-2001 2.333 2.581 0.667 9
    DAEHLIE Bjoern NOR 1998-1999 1.889 2.839 0.556 9
    SOMMERFELDT Rene GER 2003-2004 4.438 4.764 0.125 16
    DAEHLIE Bjoern NOR 1995-1996 1.929 4.943 0.429 14
    FREDRIKSSON Mathias SWE 2002-2003 4.077 5.05 0.308 13
    BAUER Lukas CZE 2002-2003 5.5 5.979 0.125 8
    ULVANG Vegard NOR 1991-1992 2.375 6.992 0.375 8
    DAEHLIE Bjoern NOR 1991-1992 3.75 7.085 0.5 8
    ANGERER Tobias GER 2006-2007 4.222 7.286 0.333 9
    ALSGAARD Thomas NOR 2001-2002 4.455 7.385 0.273 11
    Name Nation Season Avg Rank Avg Points Win Pct Num of Races
    SKARI MARTINSEN Bente NOR 2002-2003 1.75 0.862 0.833 12
    BJOERGEN Marit NOR 2004-2005 2 3.383 0.556 9
    VAELBE Elena RUS 1994-1995 2.636 3.399 0.727 11
    NEUMANNOVA Katerina CZE 2003-2004 3.143 4.5 0.571 7
    BJOERGEN Marit NOR 2010-2011 1.818 5.685 0.727 11
    BJOERGEN Marit NOR 2009-2010 2.111 6.24 0.444 9
    KOWALCZYK Justyna POL 2008-2009 3.917 6.833 0.333 12
    VAELBE Elena RUS 1992-1993 2.556 7.501 0.222 9
    LAZUTINA Larissa RUS 1997-1998 3.556 7.624 0.444 9
    BJOERGEN Marit NOR 2011-2012 1.929 7.651 0.5 14

    Not surprisingly, several names appear multiple times on each list.  Bjoern Daehlie had a lot of dominant season, but man, I remember Per Elofsson in 2000-2001.  Well, not personally.  But I do remember that he was pretty unbeatable.

    When it comes to dominating performances, though, we all have to tip our hats to Bente Skari Martinsen and her 2002-2003 season, which is considerably better than the other top seasons among the women.

    One interesting aspect of these tables is how low the win percentage is.  That’s just the proportion of races they won.  There are a few high values, notably Bente Skari Martinsen, Elena Vaelbe (1994-1995), Elofsson (2000-2001), Neumannova (2003-2004) and Bjoergen (2004-2005).  But many of these seasons (and remember, these are “best season ever” candidates) involve a skier winning less than half their races.  This should highlight how difficult it is for skiers, even the very best skiers, to win on any given day.

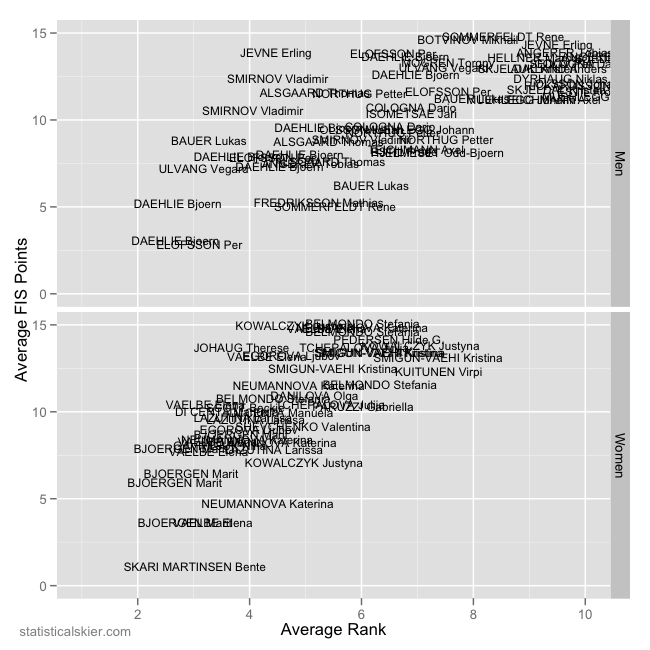
    Finally, since I can’t leave you with boring tables (even if they are sortable), here’s a graph of some of the top seasons in both dimensions: rank and FIS points.
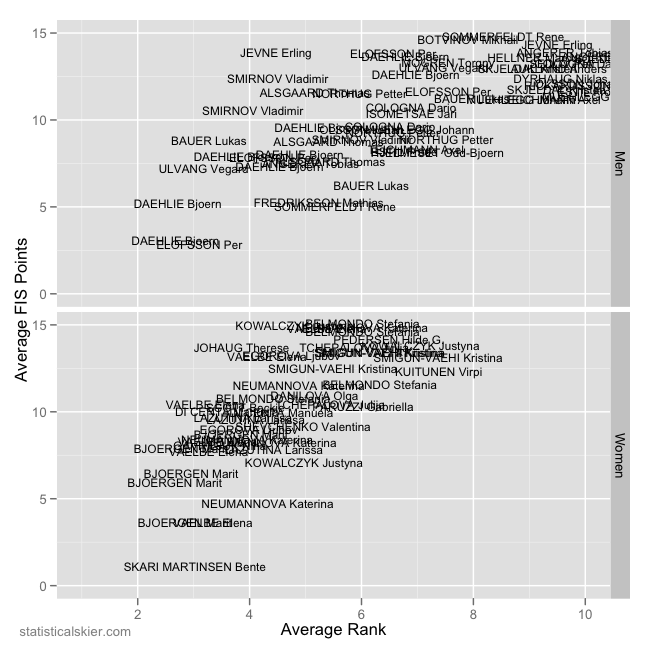
    The overplotting makes the names hard to read at times, but if you squint you can make a lot of them out.

    As for who actually wins, I’m going to skip picking a men’s and women’s winner and just say that Bente Skari Martinsen’s 2002-2003 season was pretty frickin’ incredible.  She opened the season with an 8th (9.73 FIS points) in a 5km skate race and her second to last race was a 3rd (0.61 FIS points) in a 10km skate.  But she won every other WC that year.


    Related posts:

    1. <Most Unimproved Men: Distance
    2. <Most Unimproved Women: Distance
    3. <Is It Panic Time For The Norwegian Men’s Distance Skiers?


  • Podium Development – Sprinting

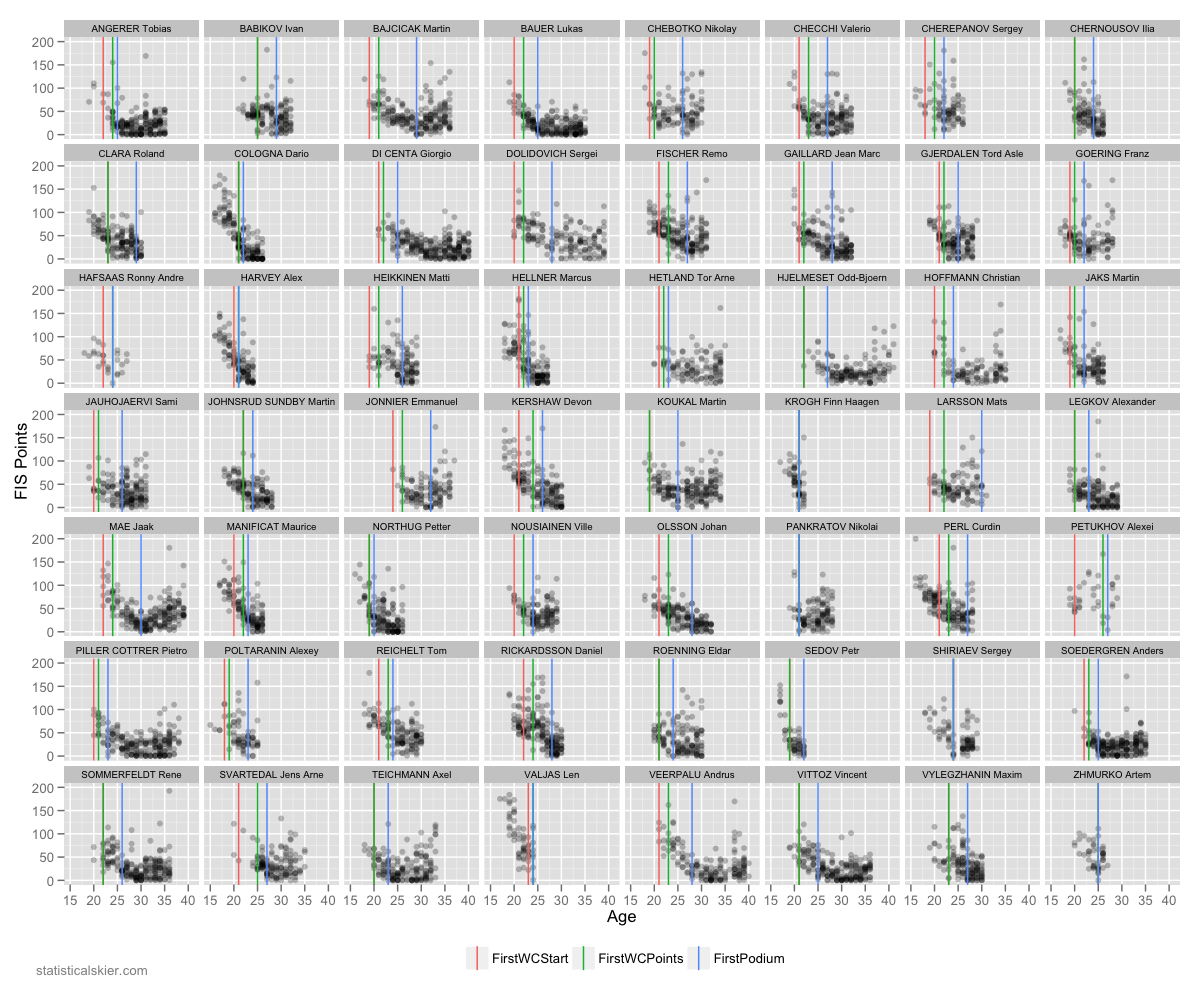
    As promised from last time, here we have the detailed development plots for sprinting. First the men:

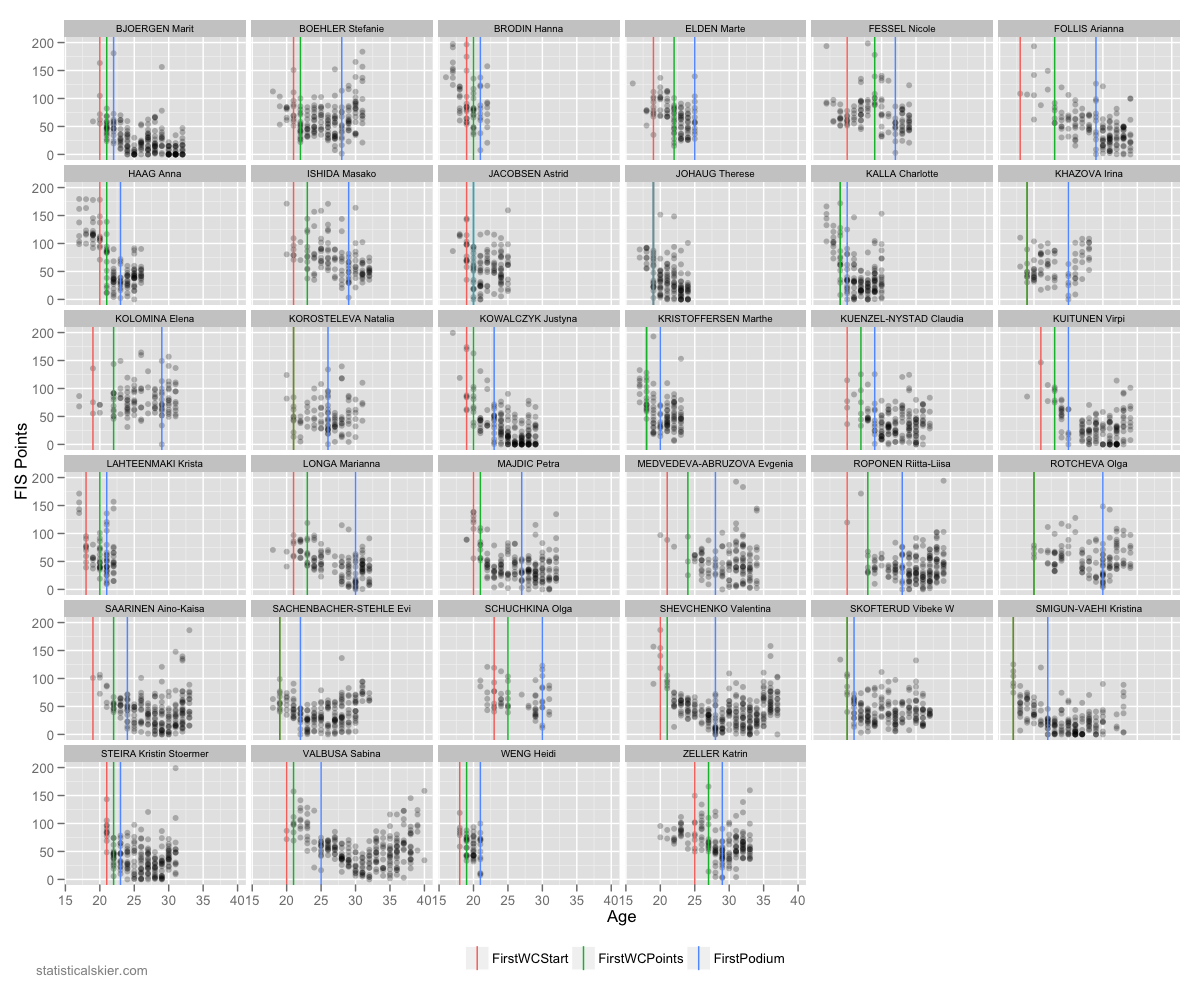
    And the women:

    As before, these are big, so click on them for the full versions. Also, remember that if you don’t see a line indicating one of the events, that’s because two or more events happened at (roughly) the same age.

    Related posts:

    1. <FIS Points Development Guide
    2. <Is Sprinting A Young Person’s Game?
    3. <Yet Another Athlete Development Marker


  • Development Patterns In Detail

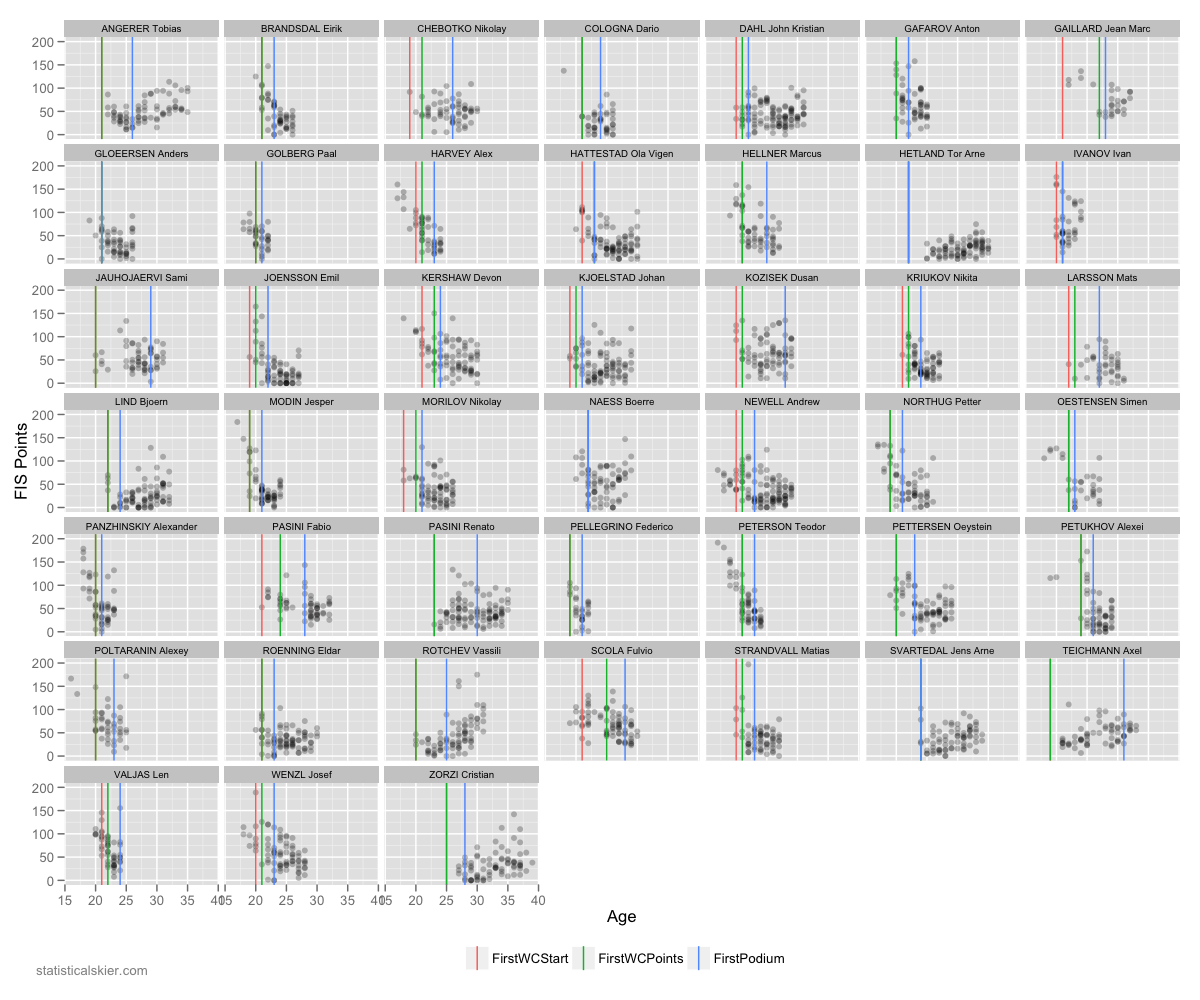
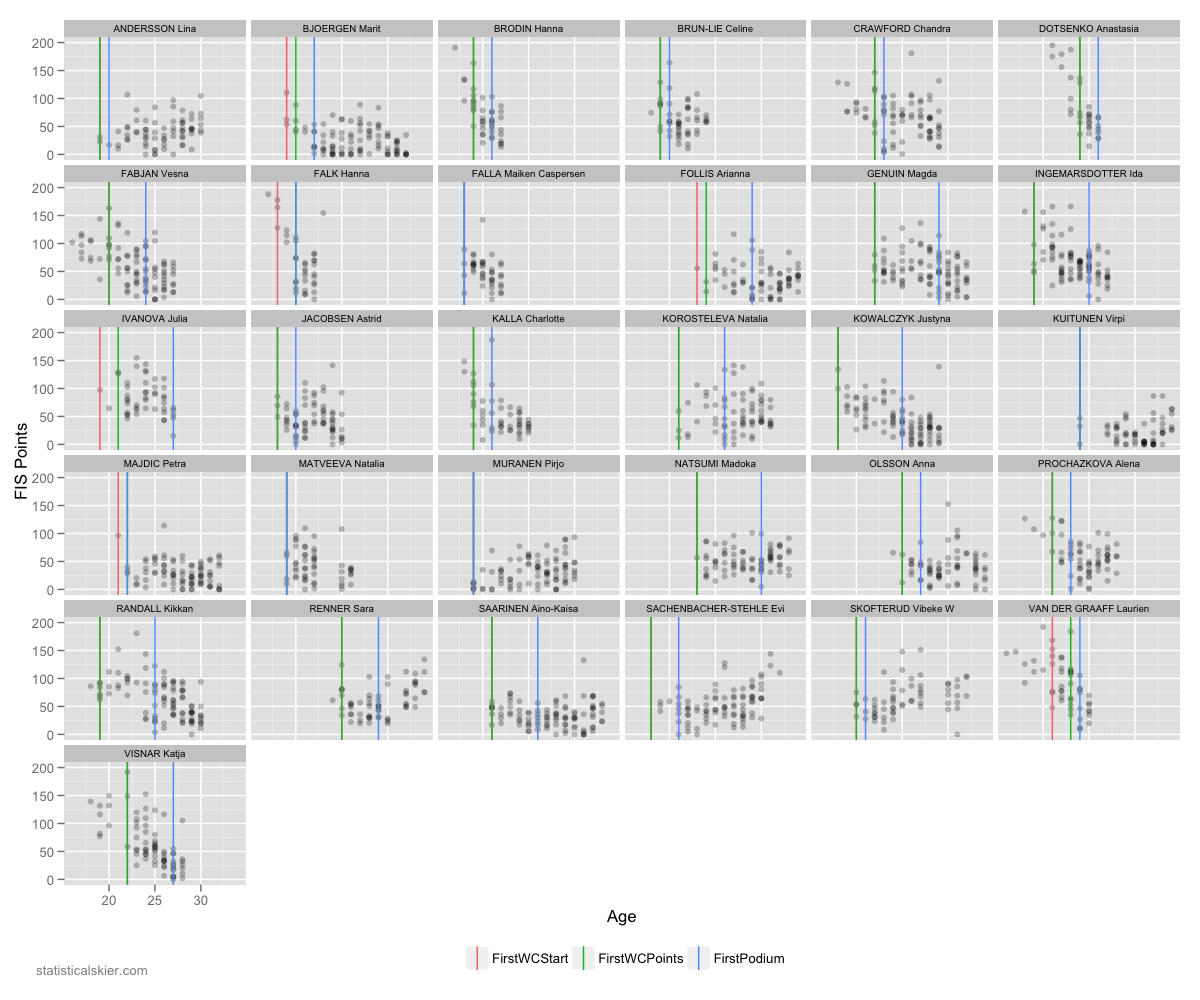
    As promised from last time, I’m going to show you the un-aggregated data from Tuesday’s plots. This means we’re going to have some big graphs, bigger than I typically think is useful, but no matter.

    I’ve plotted FIS points versus age for each of the male and female skiers with a podium result in a major international competition, and indicated the age at which each skier attained their first WC start, their first points and their first podium. If you only see two (or fewer) vertical lines, that means that some of those events happened at basically the same age. (Keep in mind that my age data is only at the resolution of a whole year.)

    First the men’s distance podium skiers (these are big; click through for full versions):

    And the women’s distance version of the same thing:

    I won’t offer much commentary, except that it’s interesting to browse through these graphs and notice the variety of different paths different skiers take. I’ll have the sprint versions on Tuesday.


    Related posts:

    1. <Post-WJC/U23 Development: Canada
    2. <FIS Points Development Guide
    3. <Applying FIS Point Development Curves To The USST


  • Development Questions

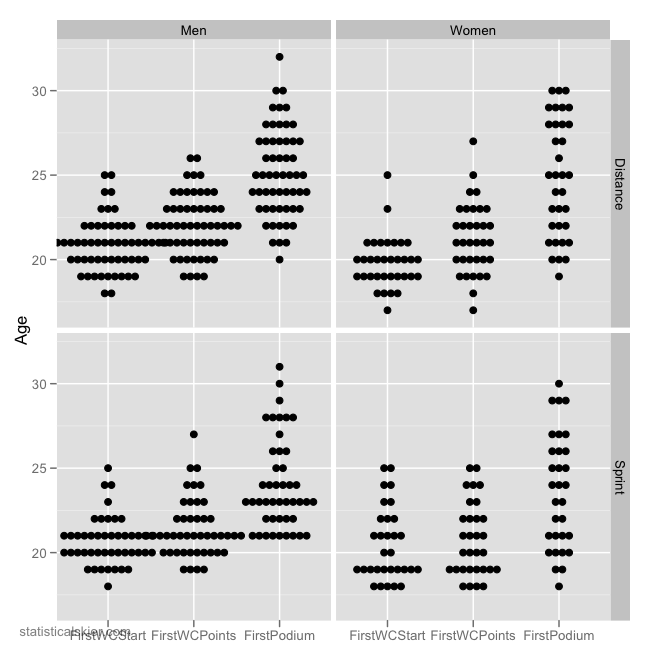
    I happened to be thinking about visualizations of athlete development recently, and in the process cooked up the following graph:

    What I’ve done here is to take the podium finishers in major international events for the past five seasons and recorded each person’s age when they received their first (individual) WC/OWG/WSC start, when they scored their first WC/OWG/WSC points (i.e. a top thirty at any of those events), and finally when they first landed on the podium.

    The style of graph here is sort of a more informative type of boxplot. Boxplots really only show you five values, so there’s a lot of lost information. Here, each dot represents a single athlete, so we can get a sense of the entire distribution of ages for each event.

    As expected, the women’s ages tend to be somewhat lower across the board; this could be development related, but I tend to ascribe it as much to differences in field depth or competitiveness. The basic story is roughly the same in each of the four panels: rarely do future podium skiers get their first “major” start after the age of 23, they finish in the top 30 after at most a year or two, and then finish in the top three maybe another 2-3 years later.

    Of course, that’s what happens with the “average” skier, which doesn’t exist. We are all our own unique snowflake. So this is still masking a fair bit of variability (that I’ll delve into a bit more on Thursday). But the basic lesson I draw from this is that if there’s a threshold to be seen here, it’s at the age of 25. The best skiers seem to have established at least the potential for scoring World Cup points before the age of 25.

    Related posts:

    1. <Post-WJC/U23 Development: Canada
    2. <Post-WJC/U23 Development: Norway
    3. <FIS Points Development Guide


  • Manuela Di Centa

    A curious report surfaced a while back that included some doping allegations around Juha Mieto and Manuela Di Centa. I can’t say that I’d ever heard any rumors about either skier in the past. As with every other post I’ve done on a skier accused of doping, this look at their results data isn’t meant to be an exercise in searching for evidence. Instead, it’s just an opportunity to go back and look at what they’ve done, so that we at least have a sense of how they actually performed.

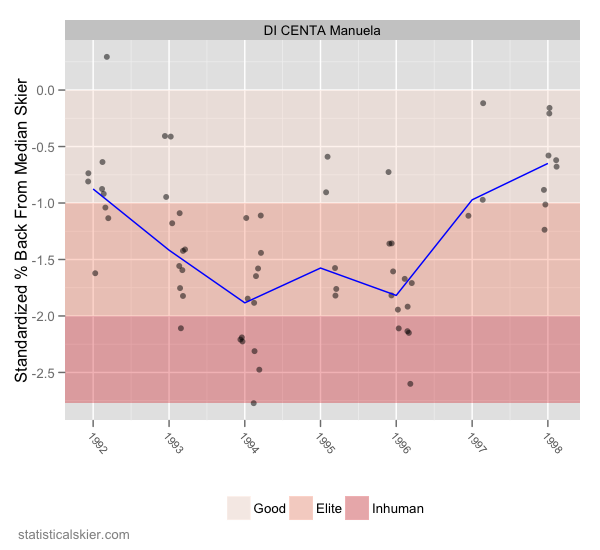
    Mieto, of course, mostly predates my complete data. Hopefully some day I’ll finish compiling the rest of the WC results back to the late 70′s (I’ve got around 60% of them at the moment). Even Di Centa’s career is only partially covered by my data. She did a handful of WC’s in her early 20′s, but her racing seemed to really pick up in 1988, and my data doesn’t really start until 1992. Regardless, here’s what we have:

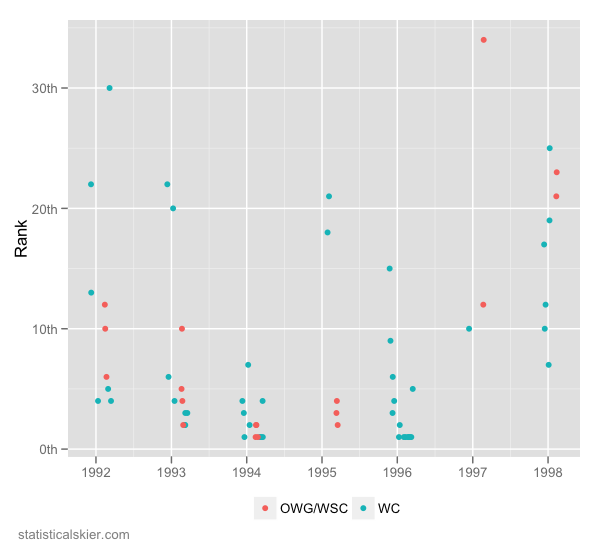
    1994 was the year she seemed to be really have “out of this world” results, relative to the field, and again to a lesser degree in 1996. Following that season, you can see her results tailed up significantly. Sandwiched in there is a seemingly “off” year in 1995. If we change our scales to finishing place, though, we see that that was an unusual season all around:

    She only did five races that season, but three of them were top 5′s at the Thunder Bay World Champs. That was long enough ago that I can’t remember what was up with her that season. But she didn’t even race at the WC’s that December that were in Italy, and I don’t see her popping up in any other FIS races either. Seems like too short a window for her to have had a baby during the off-season (though you never know, women can be pretty amazing sometimes…). Or she could have been dealing with injury or illness.

    And once again, this doesn’t really shed any light on doping accusations. It’s just an excuse to look at some results histories…

    Related posts:

    1. <The Mysteries of Andrus Veerpalu
    2. <Rybinsk: Does Anyone Care?
    3. <Most Un-Improved: Sprint 2011


  • Scoring WC Points Is Far, Far Harder Today Than In 1983

    This post is somewhat of a teaser trailer for the sorts of things we can do once we have a complete record of major international ski results stretching back to the 70′s.

    A natural and possibly controversial question is whether the World Cup field has become more or less competitive over time.  Intuitively, I think it’s clear that it probably has.  That’s just the natural progression of any sport as it attracts more money, sponsors and participants.  The skiing community as a whole simply gets better at producing fast skiers.

    But this process can make it difficult to compare the results of today’s athletes to those of many years ago.

    In a sort of XC skiing data fantasy world, we’d like to make direct comparisons between modern skiers and historical skiers (i.e. is Petter Northug faster than Gunde Svan?).  The only real way to answer that question would involve time travel.  We can, however, make relative comparisons about the entire field.  So we can ask the following: Is the average 30th place finisher on today’s World Cup closer to or further behind the winner than the average 30th place finisher in 1984?

    To do this I grabbed some preliminary data from my big data entry project.  To keep the comparison and fair (and simple) as possible, we’re only going to look at men’s interval start classic races.  (I think it’s pretty obvious that skating comparisons are going to be problematic.)

    I happened to have all the results for World Cup races from the 1982-1983 and 1983-1984 seasons, so those races will serve as our “historical” data set.  I’m assuming that all these races were classic races, which isn’t technically correct, if I have my history right.  At least a few of these races had experimental “skating zones” where people were allowed to skate for a few hundred meters at a time.  Personally, I think that’s a small enough deviation from “classic skiing” that for these purposes, we needn’t worry.

    Next, we’ll take a roughly equivalent number of modern men’s interval start classic races.  The result is around twenty historical races and twenty modern ones (from across the last several seasons, since classic interval start races are more spread out in the schedule).

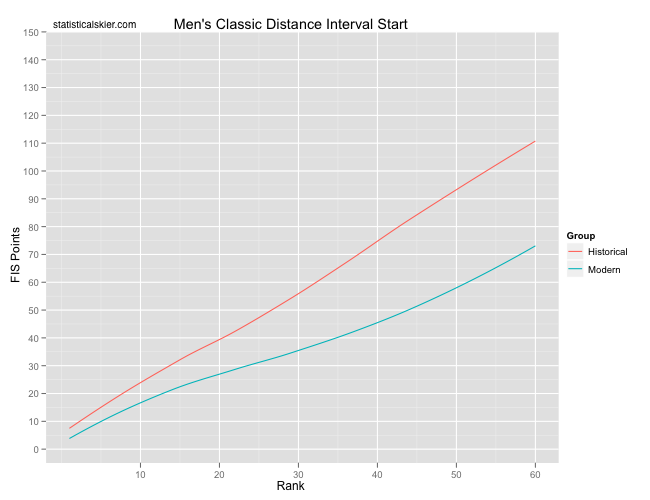
    The following graph shows the average FIS points (calculated using modern rules for all races) for both groups versus finishing place:

    I was expecting the average modern skier to be closer to the winner, but I wasn’t expecting the difference to be this large or to range across the entire field like this.

    Now, World Cup point rules have changed as well.  Back in the day, only the top twenty scored points, and the point scale differed.  Still, we can make some sensible comparisons for the average 10th, 20th, etc. place finishers here.

    For interval start races, FIS points are essentially just percent back times 800.  This means that the average male 30th place finisher in the early 80′s was ~2.5% further behind the winner than today’s average male 30th place finisher.  Two and a half percent!  That’s probably almost a minute in a 15km and just over two minutes in a 30km.

    Obviously, the point here isn’t that the skiers from back in the day were slow.  Remember, we can’t say things like that because that would be a direct comparison.  It’s just that when the sport was younger, there were fewer people able to ski close to the winner.

    The way I like to think about this is to compare the World Cup circuit to a game of musical chairs. This entails reading the above graph “backwards”. Let’s start with a 30 FIS point World Cup result. If we move across horizontally from that spot on the y axis, we see that there were typically around 15 skiers in the early 80′s who were capable of finishing that close to the leader. Continuing across the graph, we can see that that number has increased to around 25 now. So you could think of that as adding 10 people to a game of musical chairs that started with 15 people and 15 chairs.

    Related posts:

    1. <Predicting FIS Points For World Cup Races
    2. <Predicting World Cup FIS Points (con’t)
    3. <Are Women’s WC Fields Really ‘Weaker’?


  • Sprint Performance By Length (Con’t)

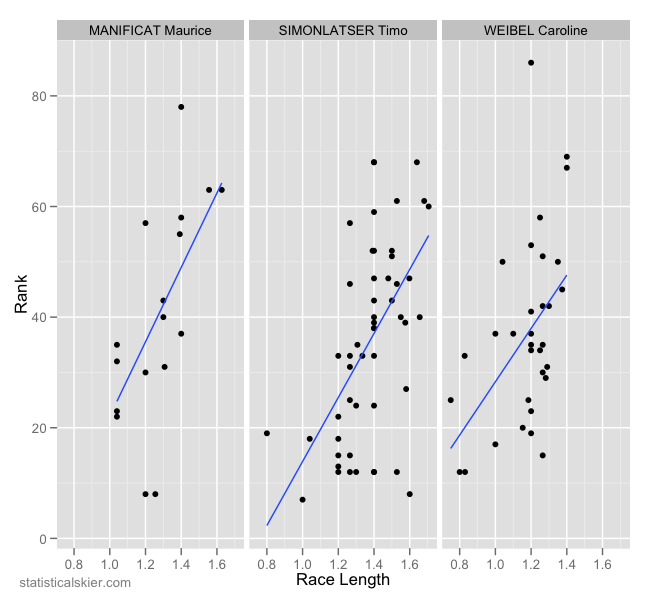
    Continuing on from last time, we’ll single out a handful of skiers who appear to do significantly better in shorter sprint courses. Same methodology as before led me to pluck out the following three skiers:

    In general, the effects in this direction tended to be weaker and less dramatic, even at the extreme ends of the distribution. Speculating wildly, I’d venture a guess that given the endurance characteristics in skiing, you’re just more likely to have people with skill sets that lend themselves toward longer distances, all things being equal.

    Manificat isn’t necessarily known for his sprinting, but he seems to have done better (in qualification, at the very least) on sprint courses closer to 1km. I find that kind of interesting because I generally think of him as being stronger in longer distance races (i.e. 30km+) though I haven’t looked at any data to check that.

    It’s tempting to dismiss Simonlater’s trend as being the result of those three shorter races. But even if you exclude them, you can see a fairly abrupt break in performance right at 1.4km. It’s verging on being a step function, rather than a continuous change. Weibel’s trend is the most marginal, in my view.

    Related posts:

    1. <Skiing Performance and Age
    2. <Trends In US Skiing Performance: Sprint
    3. <Liz Stephen’s Distance Preferences


  • Sprint Course Length Effects

    The notion of an athlete preferring distance races of a particular length is pretty familiar, but what about sprinting? The differences between a 0.8km and a 1.8km sprint course may not seem like much compared to the differences between a 15km and 30km race. But (while I’m not a physiology expert) it seems likely to me that you could very well run into much more significant differences in the physiological demands at that smaller scale, in terms of what sorts of things your body needs to be efficient at.

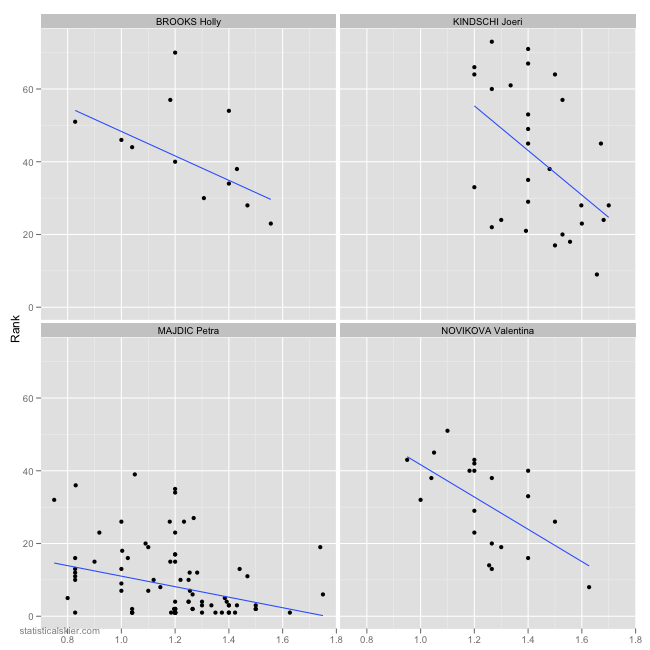
    That’s a long winded introduction to my having run through some simple linear mixed effects models that look at skiers who have a particular tendency to do better (or worse) in sprint races of different lengths. I’m going to start you off with the graph, which is fairly self-explanatory. But be warned, there will be quite a list of caveats…

    The pool I’m drawing on here are folks who’ve done at least 10 major international (WC, OWG, etc.) sprint races. One tricky thing with sprints is what you use as your response variable. I’ve chosen four of the skiers who exhibited the strongest effect in one direction, towards better performance on longer courses. I’m using the final position (not qualification rank) here. In a lot of ways, looking only at qualification speed would be “cleaner”, but I wanted a measure that captured more than just one round of the event; a measure that reflected how well you actually performed in the sprint race as a whole.

    Another big caveat here is that this graph represents all the athlete’s races, so we could be obscuring a confounding variable of changes over time. (I was particularly worried about that with Holly Brooks, but upon checking the raw data, that doesn’t seem to be the case.)

    I’m going to start with Petra Majdic, because it’s a great opening into yet another factor that can be at play here. The effect of performing better on somewhat longer sprint courses for her is probably the weakest of the four. One interesting feature is the rather sharp cutoff at around 1.2km. Since Majdic is (was) one of the fields best sprinters, ever, how can we explain the apparent tendency to perform so much worse over shorter distances? Among many possible options, one things that comes to mind is that shorter courses will tend to make races more unpredictable. Being unlucky, in terms of crashes or stumbles, has a much larger effect. So we might expect less consistency from even the best skiers on shorter courses.

    Holly Brooks is a somewhat dramatic example, particularly since so many of her results never went past qualification, so one could argue that we’re seeing something more directly reflective of her response to race effort length. On the other hand, our data for her are the most limited. Small sample size, and all that. The other two I’m not terribly familiar with.

    On Thursday we’ll look at some folks with trends in the opposite direction…


    Related posts:

    1. <New Zealand Continental Cups Sprint
    2. <Sprint Qualification Pacing Analysis
    3. <Quantifying Technique Speed Differences: Sprinting


  • Is Petter Northug Serious?

    That’s an easy one: probably not. I’m referring, of course, to his recent pronouncements about the upcoming season, in which he claims that he will win 7 World Cups, the Tour de Ski overall title, as well as 3 golds at World Championships.

    Obviously, given Northug’s history I’m not inclined to take this too seriously. He likes to make waves from time to time, which is why we love him so. But just for fun, let’s delve a bit into just how impressive a season that would be. As always, all the following comparisons will be for all seasons back to 1992 or so.

    In that time, a skier has won at least 7 individual World Cup (sprint or distance) races a total of 15 times. Five times by Bjørgen, twice by each of Kowalczyk, Kuitunen and Skari Martinsen, and once each by Di Centa, Vaelbe, Majdic and…..Petter Northug. (In case you’re wondering, this metric is a little unfair to Bjoern Daehlie, who was in his prime at a time when there were somewhat fewer WC races on the schedule, and for much of that time was basically splitting the victories with Smirnov.)

    So there’s at least some precedent for Northug’s 7 WC wins claim. Note that he’s the only male skier on that list!

    But the real kicker is actually the three WSC golds. In the modern era (i.e. since 1992), who has won at least three golds at a single major championships (Olympics or WSCs)? That has happened a total of five times, by Bjørgen (of course), but then the list gets a little, shall we say, dubious. They rest are: Myllylae in 1999, Vaelbe in 1997, and then both Lazutina and Smirnov in the somewhat infamous 1995 World Championships.

    That suggests, of course, that the only person to do both, win 7 individual WC events as well as 3 golds at a major championships in a single season is Bjørgen. (She did not race in the Tour de Ski that year.) And frankly, that season is shaping up to be a bit of an outlier even for her.

    So there you have it. If Northug comes through on his promise, I will be the first to doff my cap…but I wouldn’t bet on it.

    Related posts:

    1. <Did Petter Northug Have a Slight Edge On Marcus Hellner?
    2. <Head-To-Head: Petter Northug vs. Marcus Hellner
    3. <Back Burners: Northug, Hjelmeset & Saarinen


  • Stephen’s Climb to the Castle Margin

    Liz Stephen destroyed the women’s field this weekend in the annual Climb to the Castle rollerski race. The margin, just over 5 minutes in a race that took the leaders between 40-45 minutes is certainly impressive. But I think that margin doesn’t provide much useful information.

    Time trials that are most useful as gauges of performance trends are the ones that have the most stable, repeatable conditions. I believe Climb to the Castle has everyone using identical roller skis (at least that’s my recollection) and that helps. But as noted in the coverage, road and weather conditions can pretty severely impact times. In that light, the fact that Stephen covered the course more than a minute faster than last year in worse conditions is certainly a more reliably good indicator.

    But even then, it’s sort of crucial to note how the race dynamics played out. Stephen skied alone basically the whole way this year. Last year, it sounded like she skied alone for over half the race. That will tend to make those efforts more similar to those produced by a interval start race, which are easier to compare, I think. For example, it’s hard to read much into the fact that Sargent skied around 2.5 minutes slower this time around, since once Stephen was off the front it’s easy for “group racing” mentalities to take over common in mass start events that slow the pace.

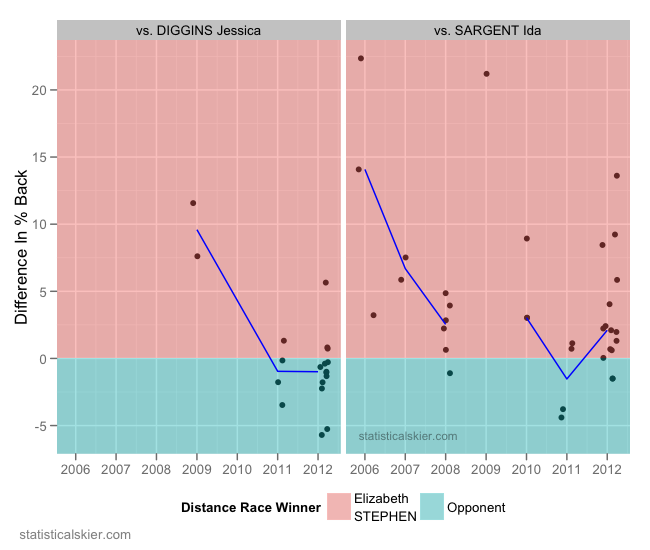
    Even if we ignore all that, consider than Sargent and Diggins were around 12.3% and 11.7% behind Stephen. Looks at their head-to-head results from recent history, it’s hard to believe that Stephen really is that much faster than Sargent and Diggins:

    Diggins was actually frequently faster than Stephen last season, and even then it was unusual for the margin between them to be more than 2.5% in either direction. Even Sargent, who had somewhat of a rough season, was almost never more than 10% behind Stephen.

    As a data guy, I’d love to see Climb to the Castle run as an interval start race, which would somewhat improve it’s use as a benchmark, but you’d still have a hard time accounting for differences in weather, particularly wind. But obviously, that’s logistically more complicated.

    Related posts:

    1. <Beitostølen FIS Race Recap: Women
    2. <Climb To The Castle – Men
    3. <Climb To The Castle – Women


  • Swedish Women By Individual

    Following up from last time, we’ll look a little more closely at the individual trends among some of the top Swedish women in distance and sprint events.

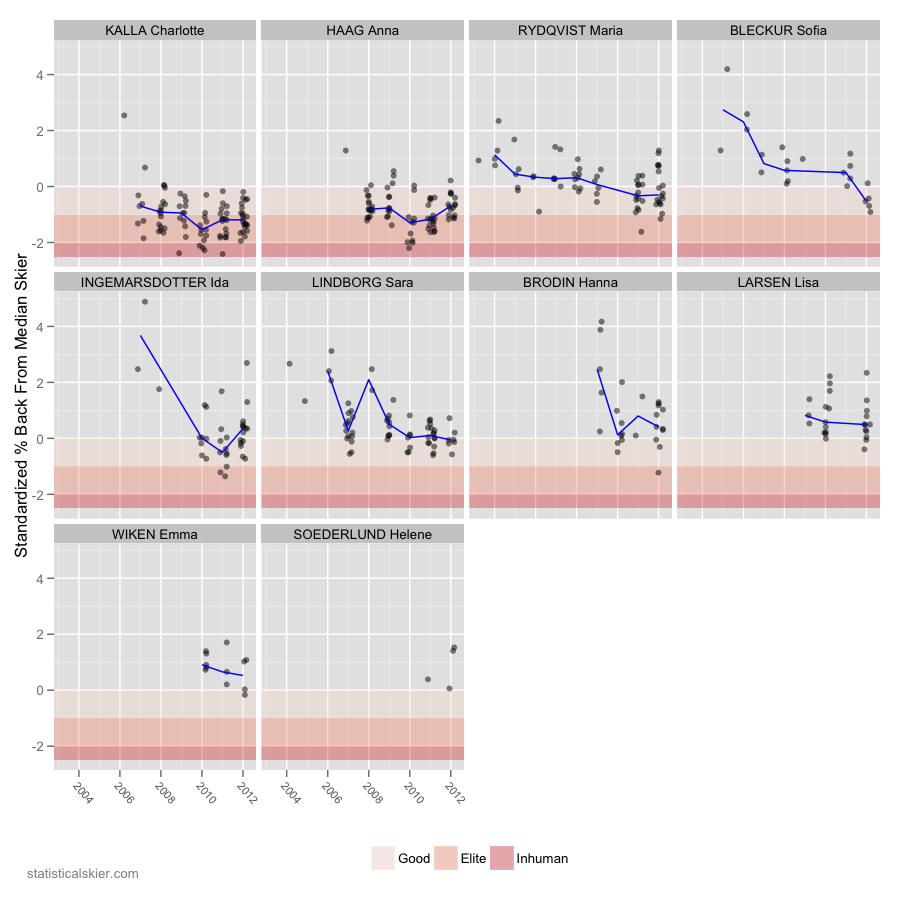
    First the distance skiers (click through for a larger version):

    Not surprisingly, Charlotte Kalla is generally the top performer here. But notice that there’s a bit of a solid drop off after her and Anna Haag. Maria Rydqvist surprised many by coming back from a year off with some very solid results, but then seemed to hit a bit of a plateau last season. Sofia Bleckur took a large jump last season, but the move from 0.5-1 standardized percent behind the median skier to -0.5 to -1 standardized percent behind the median isn’t quite as challenging. The next jump will likely be orders of magnitude harder.

    I believe I’ve commented on this before, but Anna Haag’s trend over the past three seasons is a bit worrying. The Swedish women had a very strong year in 2010, but both Kalla and especially Haag seem to have experienced a bit of “regression to the mean”. That makes me wonder whether Haag’s 2010 campaign (and to a certain extent even Kalla’s) was the best we’ll see from her.

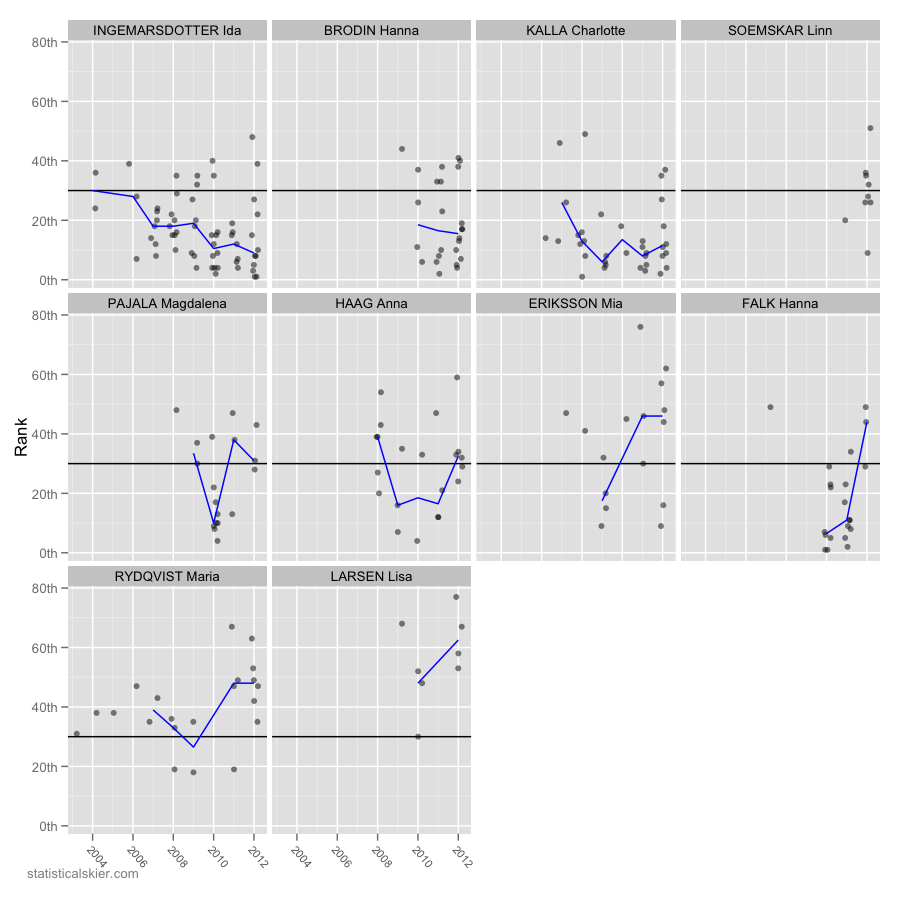
    As for the sprinters (again, click for full version):

    I certainly like the looks of Ingemarsdotter’s trend there: steady improvement over more than 2 seasons with little signs of a plateau. Hanna Falk appears extremely promising but I believe she had some strange medical issues last season that now I’m suddenly very fuzzy on. Something to do with her eyes, maybe? I can’t quite remember.


    Related posts:

    1. <Most Improved: Women’s Distance
    2. <Most Improved: Women’s Distance
    3. <Most Un-Improved: Women’s Distance


  • Swedish Women

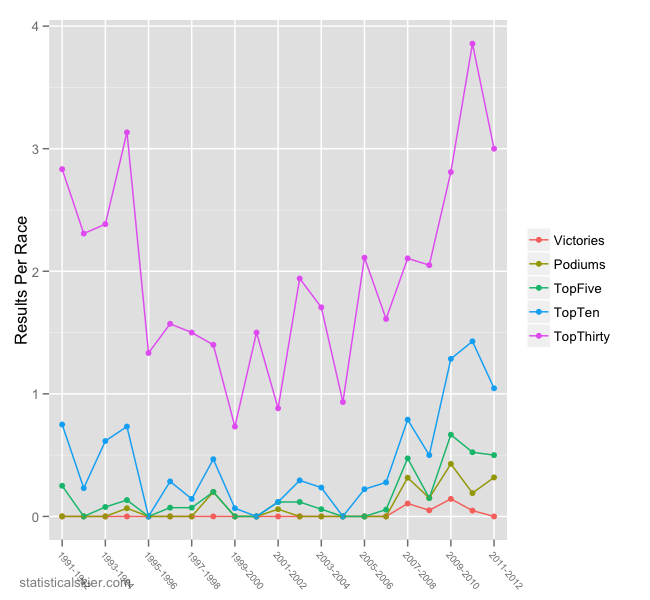
    Reading the recent interview with Rikard Grip, the Swedish women’s coach got me thinking about how they’ve fared recently. From a very broad perspective for the whole team, we have the following in distance events:

    Clearly their depth has greatly improved, as evidenced by the dramatic rise in the number of top 30 results per WC race. Most other categories are generally up as well over the last 4-5 seasons. I try not to read too much into the (rather noisy) year to year variations in these plots, but instead try to folks are broader trends over several seasons.

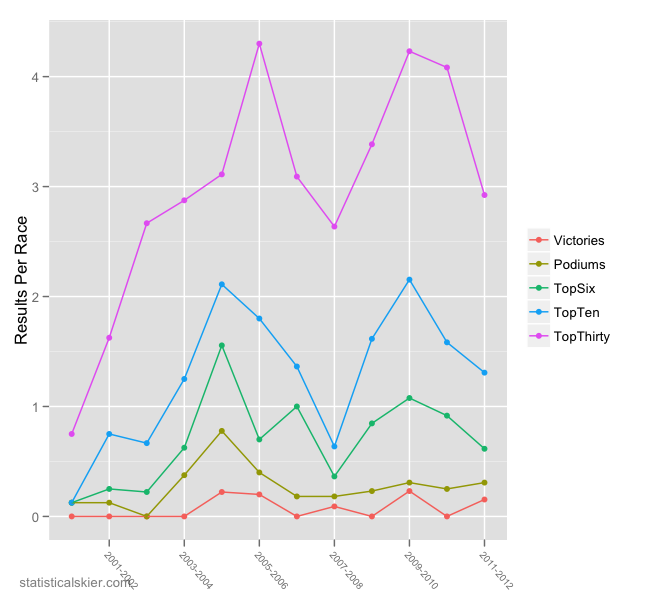
    On the sprinting side:

    Thing actually seem to be declining slightly over the past three seasons here across the board, though thanks largely to Ida Ingemarsdotter not at the victory/podium level. I also find it interesting how the two obvious peaks in performance in terms of placing women in the top 30, 10 or 6 seem to coincide with Olympic years (but not 2002). There might be a glimmer of that trend at the podium/victory level but it’s hard to interpret changes in numbers that slight.

    On Thursday we’ll take a closer look at the individual women on the Swedish squad.

    Related posts:

    1. <Most Improved: Women’s Sprint
    2. <Comparing Variability In Men’s & Women’s Sprinting
    3. <European Mid-Season Review


  • How long will Freeman and Randall remain on top?

    Kris Freeman and Kikkan Randall have been basically the top US skiers for quite some time now. (I’m sort of brushing Andrew Newell under the rug here, mostly just due to time contraints. I’ll do a follow up on him next week.)

    Freeman has been more or less unquestionably the best US male distance skier for what seems like forever, and Randall has been fairly dominant domestically in both distance and sprint events. How long can this last? Not forever, of course. Nothing lasts forever.

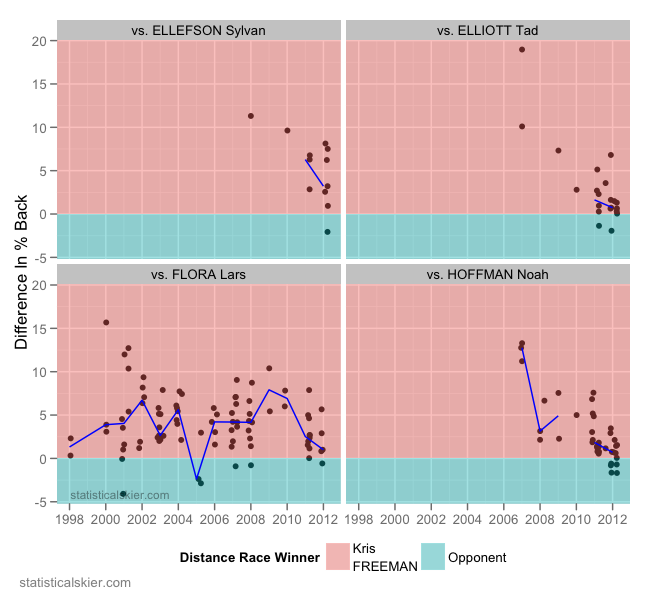
    But it seems like the shift may happen sooner on the men’s side than the women’s. Here’s what I mean:

    This shows the head-to-head results of Freeman against a handful of the better US men’s distance skiers in recent years. Certainly, Freeman has way more wins (above zero, in the pink) than losses (below zero, in the blue). But the gaps are generally narrowing.

    Now, there’s a big caveat here in that I can’t say much about whether Freeman is getting slower, or these guys are getting faster, or even if Freeman is getting faster but these guys are getting faster faster. (That made you think for a second, didn’t it?) Or maybe they’re all getting slower, and Freeman is getting slower faster. (See, now I’m just having fun messing with your head.) The point is that these are just relative comparisons, not absolute ones.

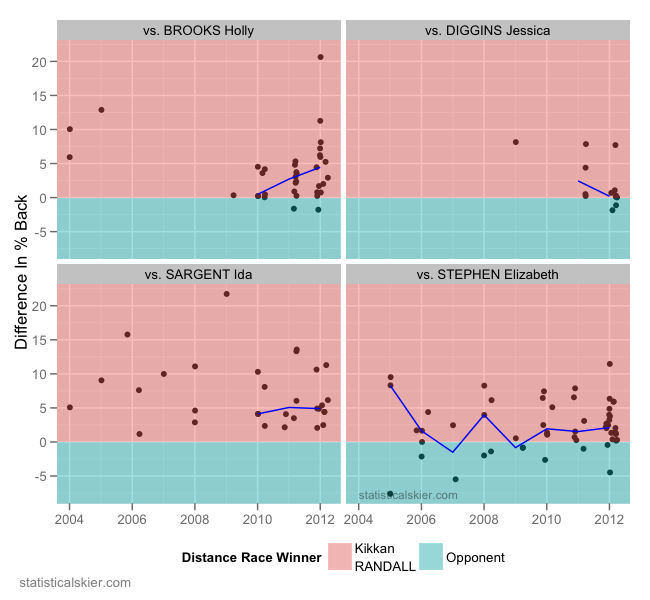
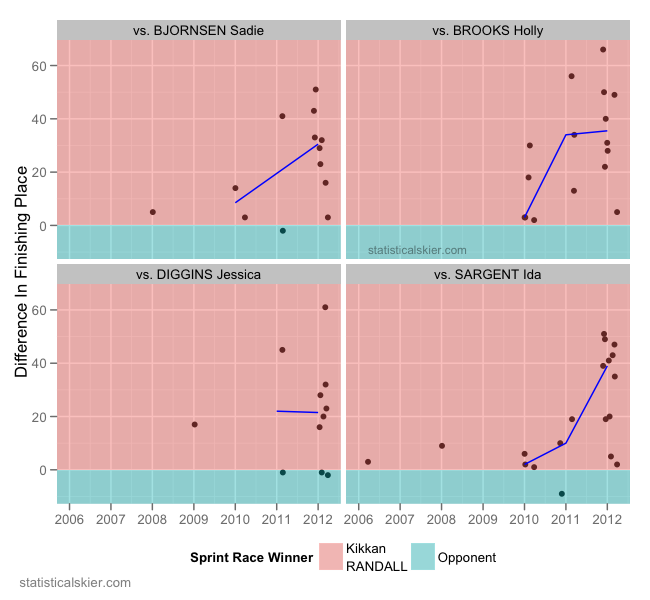
    In any case, what does the similar picture look like for Kikkan Randall?

    This is the same graph for Randall, in distance events. Jessie Diggins seems to be chipping away at the gap, but the other three look fairly flat. The seemingly steep decline for Brooks is mostly an illusion, and is due to her injury struggles this past season. Without those races, her trend would be mostly flat, or perhaps very slightly down.

    Things look even more dramatic in sprinting, as you might expect:

    Again, this probably reflects Randall’s recent improvements more than any decline on the other ladies’ parts. But my point remains that it seems likely that Randall will remain on top in the near future, but I’m less certain about Freeman.

    Related posts:

    1. <Victims & Nemeses: Kris Freeman
    2. <Is Qualifying In The Top Ten A Good Sign For Kikkan?
    3. <Top 10 Qualification vs. Making The Final


  • Øystein Pettersen’s Sprinting

    Since the interviews on the FIS websites is one of my main sources of post topics during the off season, we’ll continue in that vein with one from a while back with Øystein Pettersen. In it, he talks about how his focus this season is (unsurprisingly) the classic sprint at World Championships.

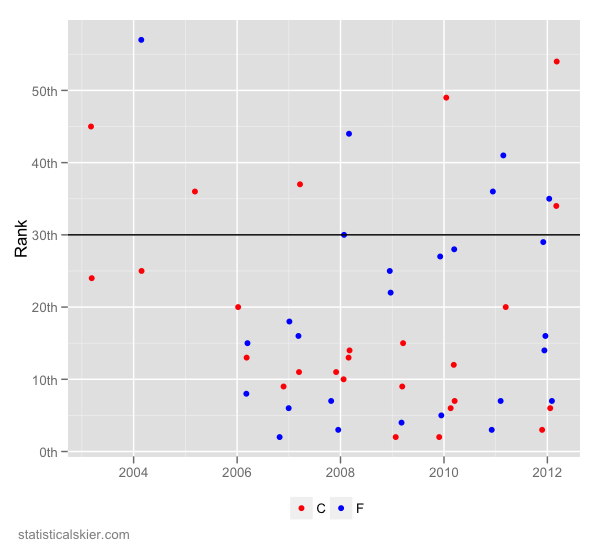
    Pettersen has been slightly better at classic sprints, on average, but overall he’s been pretty balanced:

    I guess I’d say that at least until the last two seasons, his classic sprinting has been slightly better, if only because it had been somewhat more consistent. In general, his consistency took a slight hit recently, with slightly more results falling outside the top 30.

    This sort of track record would make him a shoe-in for the World Championship team in many other nations, but in Norway things are competitive enough that Pettersen notes in the the interview that he’ll have to qualify. So he’ll be doing as many classic sprints as he can leading up to WSCs in order to prove himself.

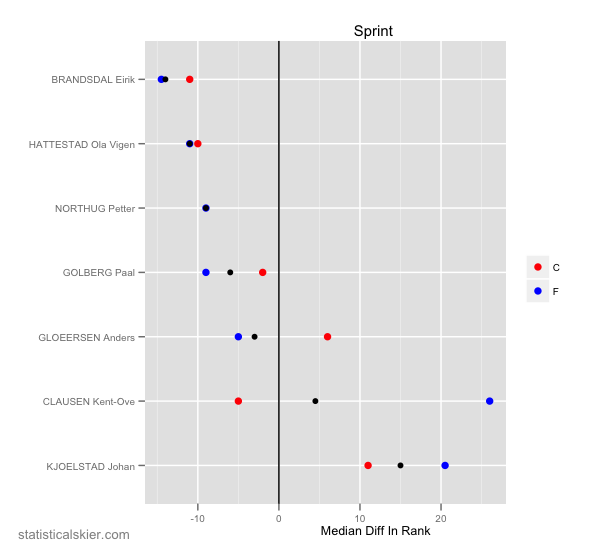
    How competitive is that effort going to be? Well, let’s compare Pettersen directly to a handful of other top Norwegian male sprinters from last season:

    Remember that negative values are bad for Pettersen (i.e. the other skier tended to prevail) and vice versa. And these values are from instances where Petteresen raced against these guys, so these are head to head matchups. You’ve got three guys who were landing around 10 places better than Pettersen with some regularity, and then even Golberg and Clausen tended to be slightly better specifically in classic sprints. Of course, you never know who’s going to be skiing fast several months from now, but it’s going to be a tough road to qualify for the men’s sprint for Norway.


    Related posts:

    1. <Technique Preferences: Norway
    2. <Sweden’s Men’s Sprinting
    3. <Can Kikkan Randall Win The Sprint WC Title?