From the FasterSkier archive — posts syndicated from athletes’ and coaches’ own blogs between 2004 and 2012, kept online as published. Current coverage is at fasterskier.com.

Tag: lactate testing

  • Heart Rate Varies. So Does Every Other Training Metric.

    Heart Rate Varies. So Does Every Other Training Metric.

    This article was made possible through the generous support of our voluntary subscribers. If you value coverage like this, please support FasterSkier with a voluntary subscription.

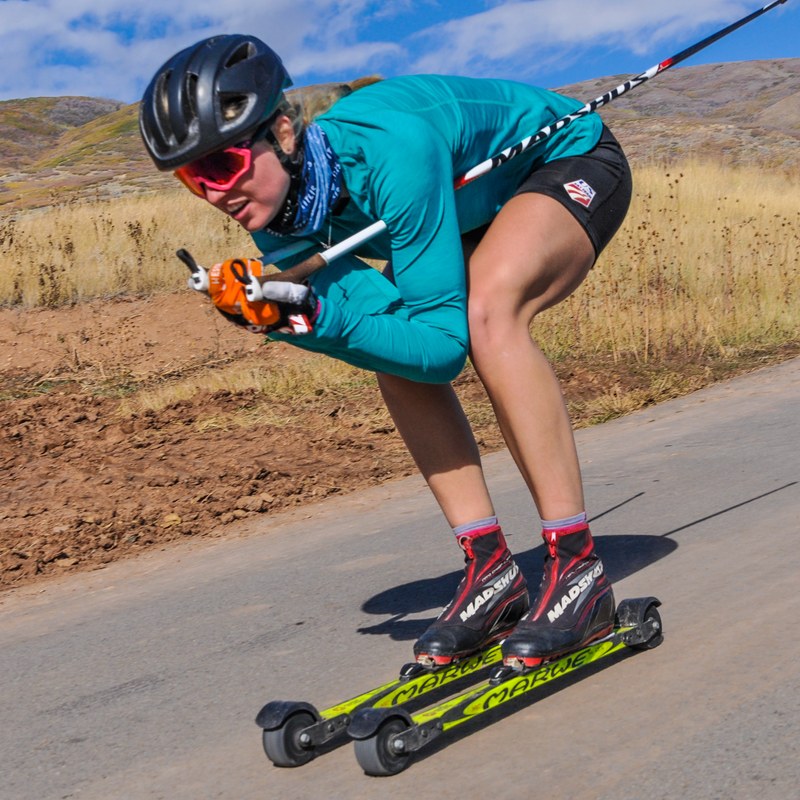
    Hailey Swirbul in a teal top, black helmet and orange goggles crouched low on rollerskis on a paved road with dry grassy hills behind
    Hailey Swirbul during an intensity session at a U.S. Ski Team camp in Park City, Utah, in October 2018. The same pace can cost an athlete very different amounts from one day to the next. (Photo: Matt Whitcomb)

    In my last article on training zones, published on FasterSkier, I tried to describe the challenges we face when we don’t use a common language. There is a lot of talk on social media about Zone 2 training, while most of us in the cross-country ski world understand this same training intensity as Zone 1. Others challenge the use of heart rate to set zones at all. These discussions are great, because they push all of us to better explain our beliefs and how we got there.

    Today I want to share why I think heart rate is, for most athletes, a useful, available indicator of cardiovascular stress, even though it doesn’t necessarily capture the complete cost of exercise. I often hear that heart rate is too variable: heat and other environmental conditions can change it; fueling, hydration and fatigue can affect it; it doesn’t stay the same at the same workload (pace or power); and it doesn’t react quickly enough during hard efforts. All of which has some truth to it!
    Two women in blue tank tops bounding uphill with poles on a dirt road, with a trailer and mountains behind them
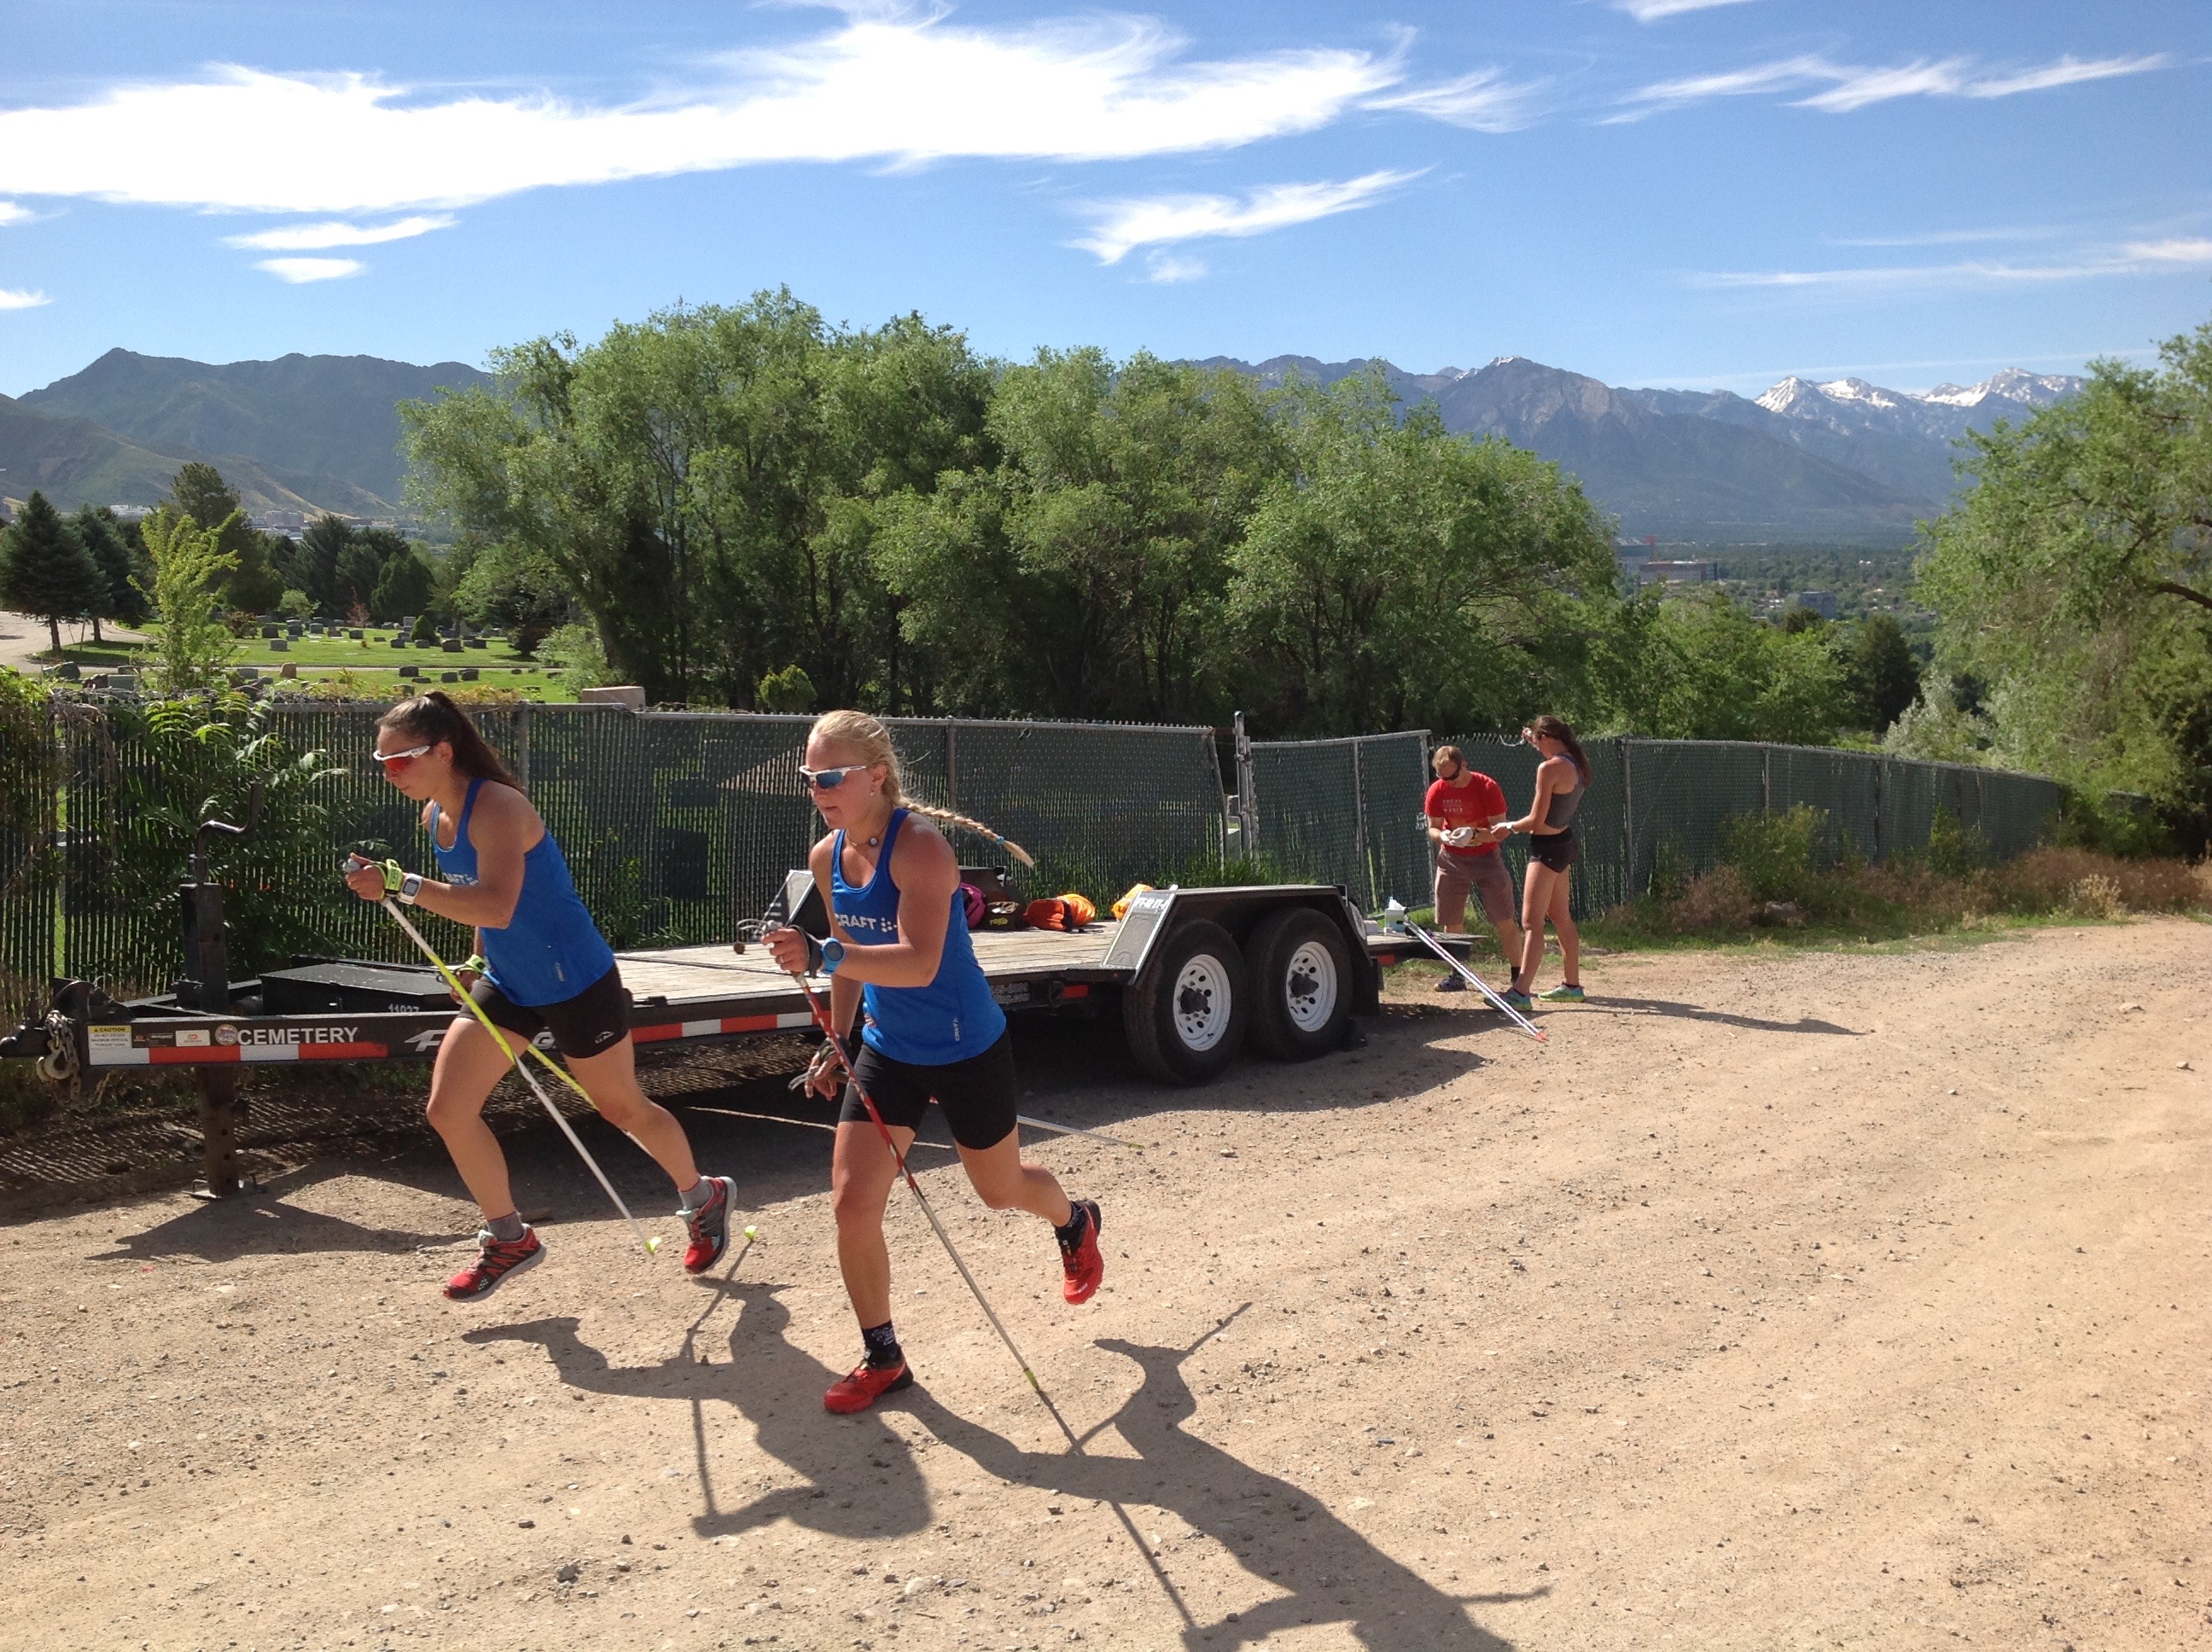
    Hannah Halvorsen (left) ski bounding in Park City, Utah, in June 2016. Heat, altitude, fueling and fatigue all change what a given pace costs, and heart rate reflects that cost. (Photo: Bryan Fish)

    Cost or Pace?

    But let’s break it down. For all endurance work, from easy endurance work below 72 percent of maximum heart rate up to high-intensity work at 95 percent of maximum heart rate, heart rate is an indicator of the physiological demand and strain associated with producing energy. So when it is said that we should use other metrics to implement and track training because of these variations, I say, really? Shouldn’t we train day in and day out based on how the body responds to those external conditions? The same pace, power, speed or workload can carry widely different physiological demands on any given day. So what are we trying to train: the metabolic cost, or the speed, power or pace we can maintain? I would argue both, but in very different circumstances.

    I should note that while I use percentages of maximum heart rate to discuss training, that doesn’t mean percentages of maximum heart rate are the best way to determine training zones. It is not a bad method if you test for maximum heart rate, but there may be better ways to use actual performance data to set training zones.

    Two skiers in U.S. suits and Coop athlete bibs striding side by side up groomed classic tracks in low winter sun
    David Norris and Scott Patterson during a set of pre-race classic intervals. Outside of heart rate and perceived effort, few training metrics get measured every day. (Photo: Tom Horrocks)

    Every Metric Moves

    Then there are those who say we should use lactate, heart rate variability (HRV), rating of perceived exertion (RPE), ventilation, respiratory exchange ratio (RER) and other metrics that change with improved fitness. In fact, those may be better or similar metrics. The problem is that, except for RPE, they are not typically measured daily, so coaches don’t see how much they can vary from one day to the next. Any measure requires context to understand its daily variation. Why? Because the body changes every day in response to life and training stressors.

    All of these measures require context, consistent testing protocols and an understanding of their day-to-day variability to be effective. The bottom line is that we need metrics that can be measured daily to understand how athletes are responding and adapting to training. When we are doing aerobic endurance training, often described as Zone 2 and, in the ski world, as Zone 1, the oxygen cost is reasonably reflected in heart rate during exercise.

    Certainly, the metabolic cost of training changes from day to day with internal and environmental factors, which can require a higher heart rate to produce the same energy output. We also see heart-rate drift during these workouts: at the same pace or power, heart rate climbs. My response is, OK, this represents an increase in internal cost, and we should definitely respond to it. No metric is perfect, but heart rate captures an important and significant part of the internal strain of training.
    Two skiers in red shorts and heart rate straps skating on a wide rollerski treadmill while two coaches watch from the side
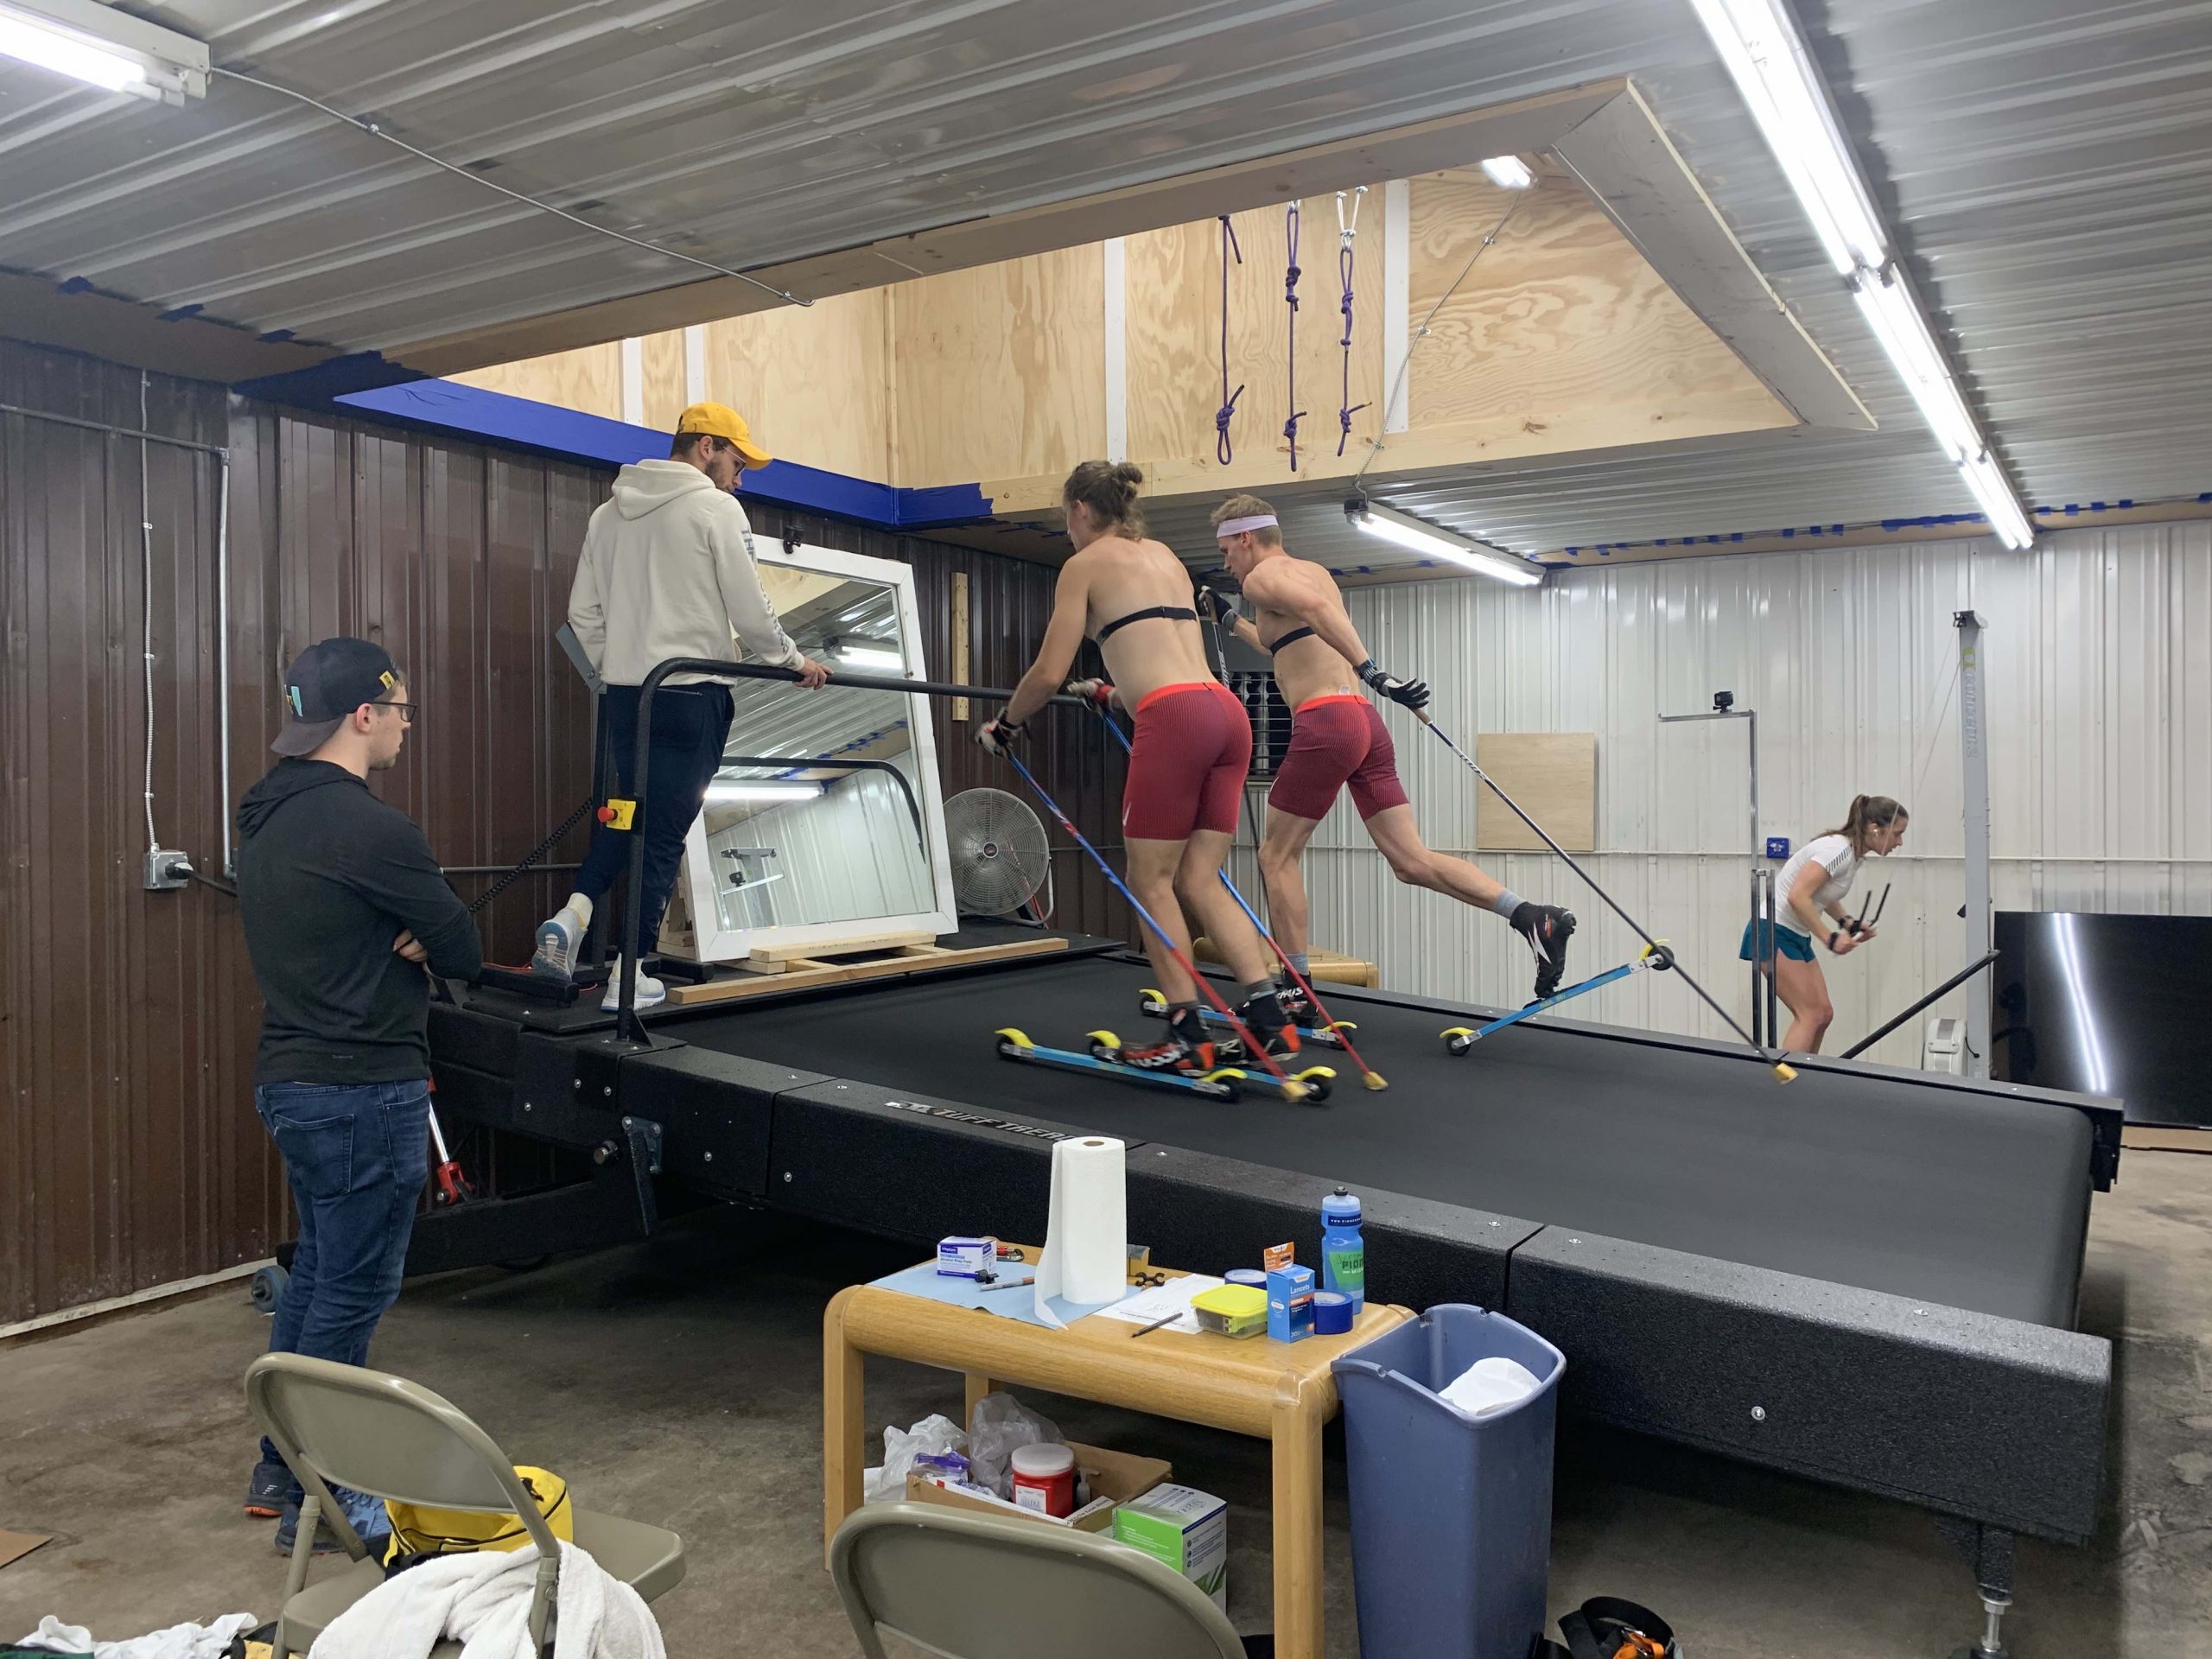
    Team Birkie’s Xavier Mansfield (left) and Zak Ketterson share a rollerski treadmill in 2021 while coaches Leo Hipp and Jeremy Hecker give feedback. A lab number is a snapshot unless it is measured often enough to show its own daily variation. (Courtesy photo)

    Variation You Never See

    To those who say other measures (ventilation, HRV, lactate levels, respiratory exchange ratio, respiration and others) are more accurate, OK. But without seeing how those measures change from day to day, you have no idea of the variation. People use lactate to guide training, for example, and the same goes for newer measures of muscle oxygen saturation and ventilation. They often set training zones at arbitrary levels, or from equally arbitrary estimates based on a visual read of a lactate curve, then assign work based on those values. But if lactate is not measured often during daily training, you have no idea how consistent those values are, or how they vary in response to the same factors that affect heart rate. From my observations, all of those metrics vary as much as heart rate.

    No matter how we cut it, none of these measures is as precise as we like to think, because the body changes and responds daily to stress and external factors. And yes, what we are after is a measure we can observe every day. So let’s recognize the facts. Heart rate represents the internal cost of work. Sure, there are daily variations. But over time, and with context, we can understand those changes.
    Two classic skiers striding through a stand of tall pines, blurred by the camera's pan
    Kendall Kramer (right) in the 10 k classic at the Lahti World Cup on March 8, 2026, an interval-start race she finished in 27:40.8. Galanes puts races of 15 to 30 minutes in the middle of Zone 4. (Photo: Authamayou/NordicFocus)

    How I Set Zones

    So this is how I use training zones. First, I use the zones as a tool to implement and assess the effects of training on each individual. Those assessments help us determine whether the zones and the training are effective. I believe training zones provide a reasonable method that will work for most athletes and doesn’t require regular lactate or lab testing or other expensive equipment.

    So what do I do? I don’t do regular lab testing, because the athletes I coach live all over the country and many don’t have access to or opportunities for it. It is also quite expensive, and most importantly, I have often seen over the years that what we learn in a lab setting doesn’t correlate with what we see in training.

    I do a six-minute test, which, according to research by Véronique Billat, corresponds to the pace at which VO2max is achieved. I use the average heart rate of the last two to three minutes of the test, and I assume that to be about 94 to 95 percent of maximum heart rate. Yes, I assume! But the six-minute test also gives me a repeatable field performance and a high heart-rate observation. I use it to inform my initial estimates, not as a direct measurement of VO2max pace or maximum heart rate. The point is to establish workable ranges, observe how the athlete responds and revise them when the evidence warrants it.

    I also look at racing and high-intensity workout performance. Short races of 10 to 15 minutes should be in the top range of Zone 4. Races of 15 to 30 minutes should be in the mid-range of Zone 4, and races of 45 to 60 minutes in the low to mid-levels of Zone 4.
    Aerial view of a curving paved rollerski loop winding through dry grass and scattered pines
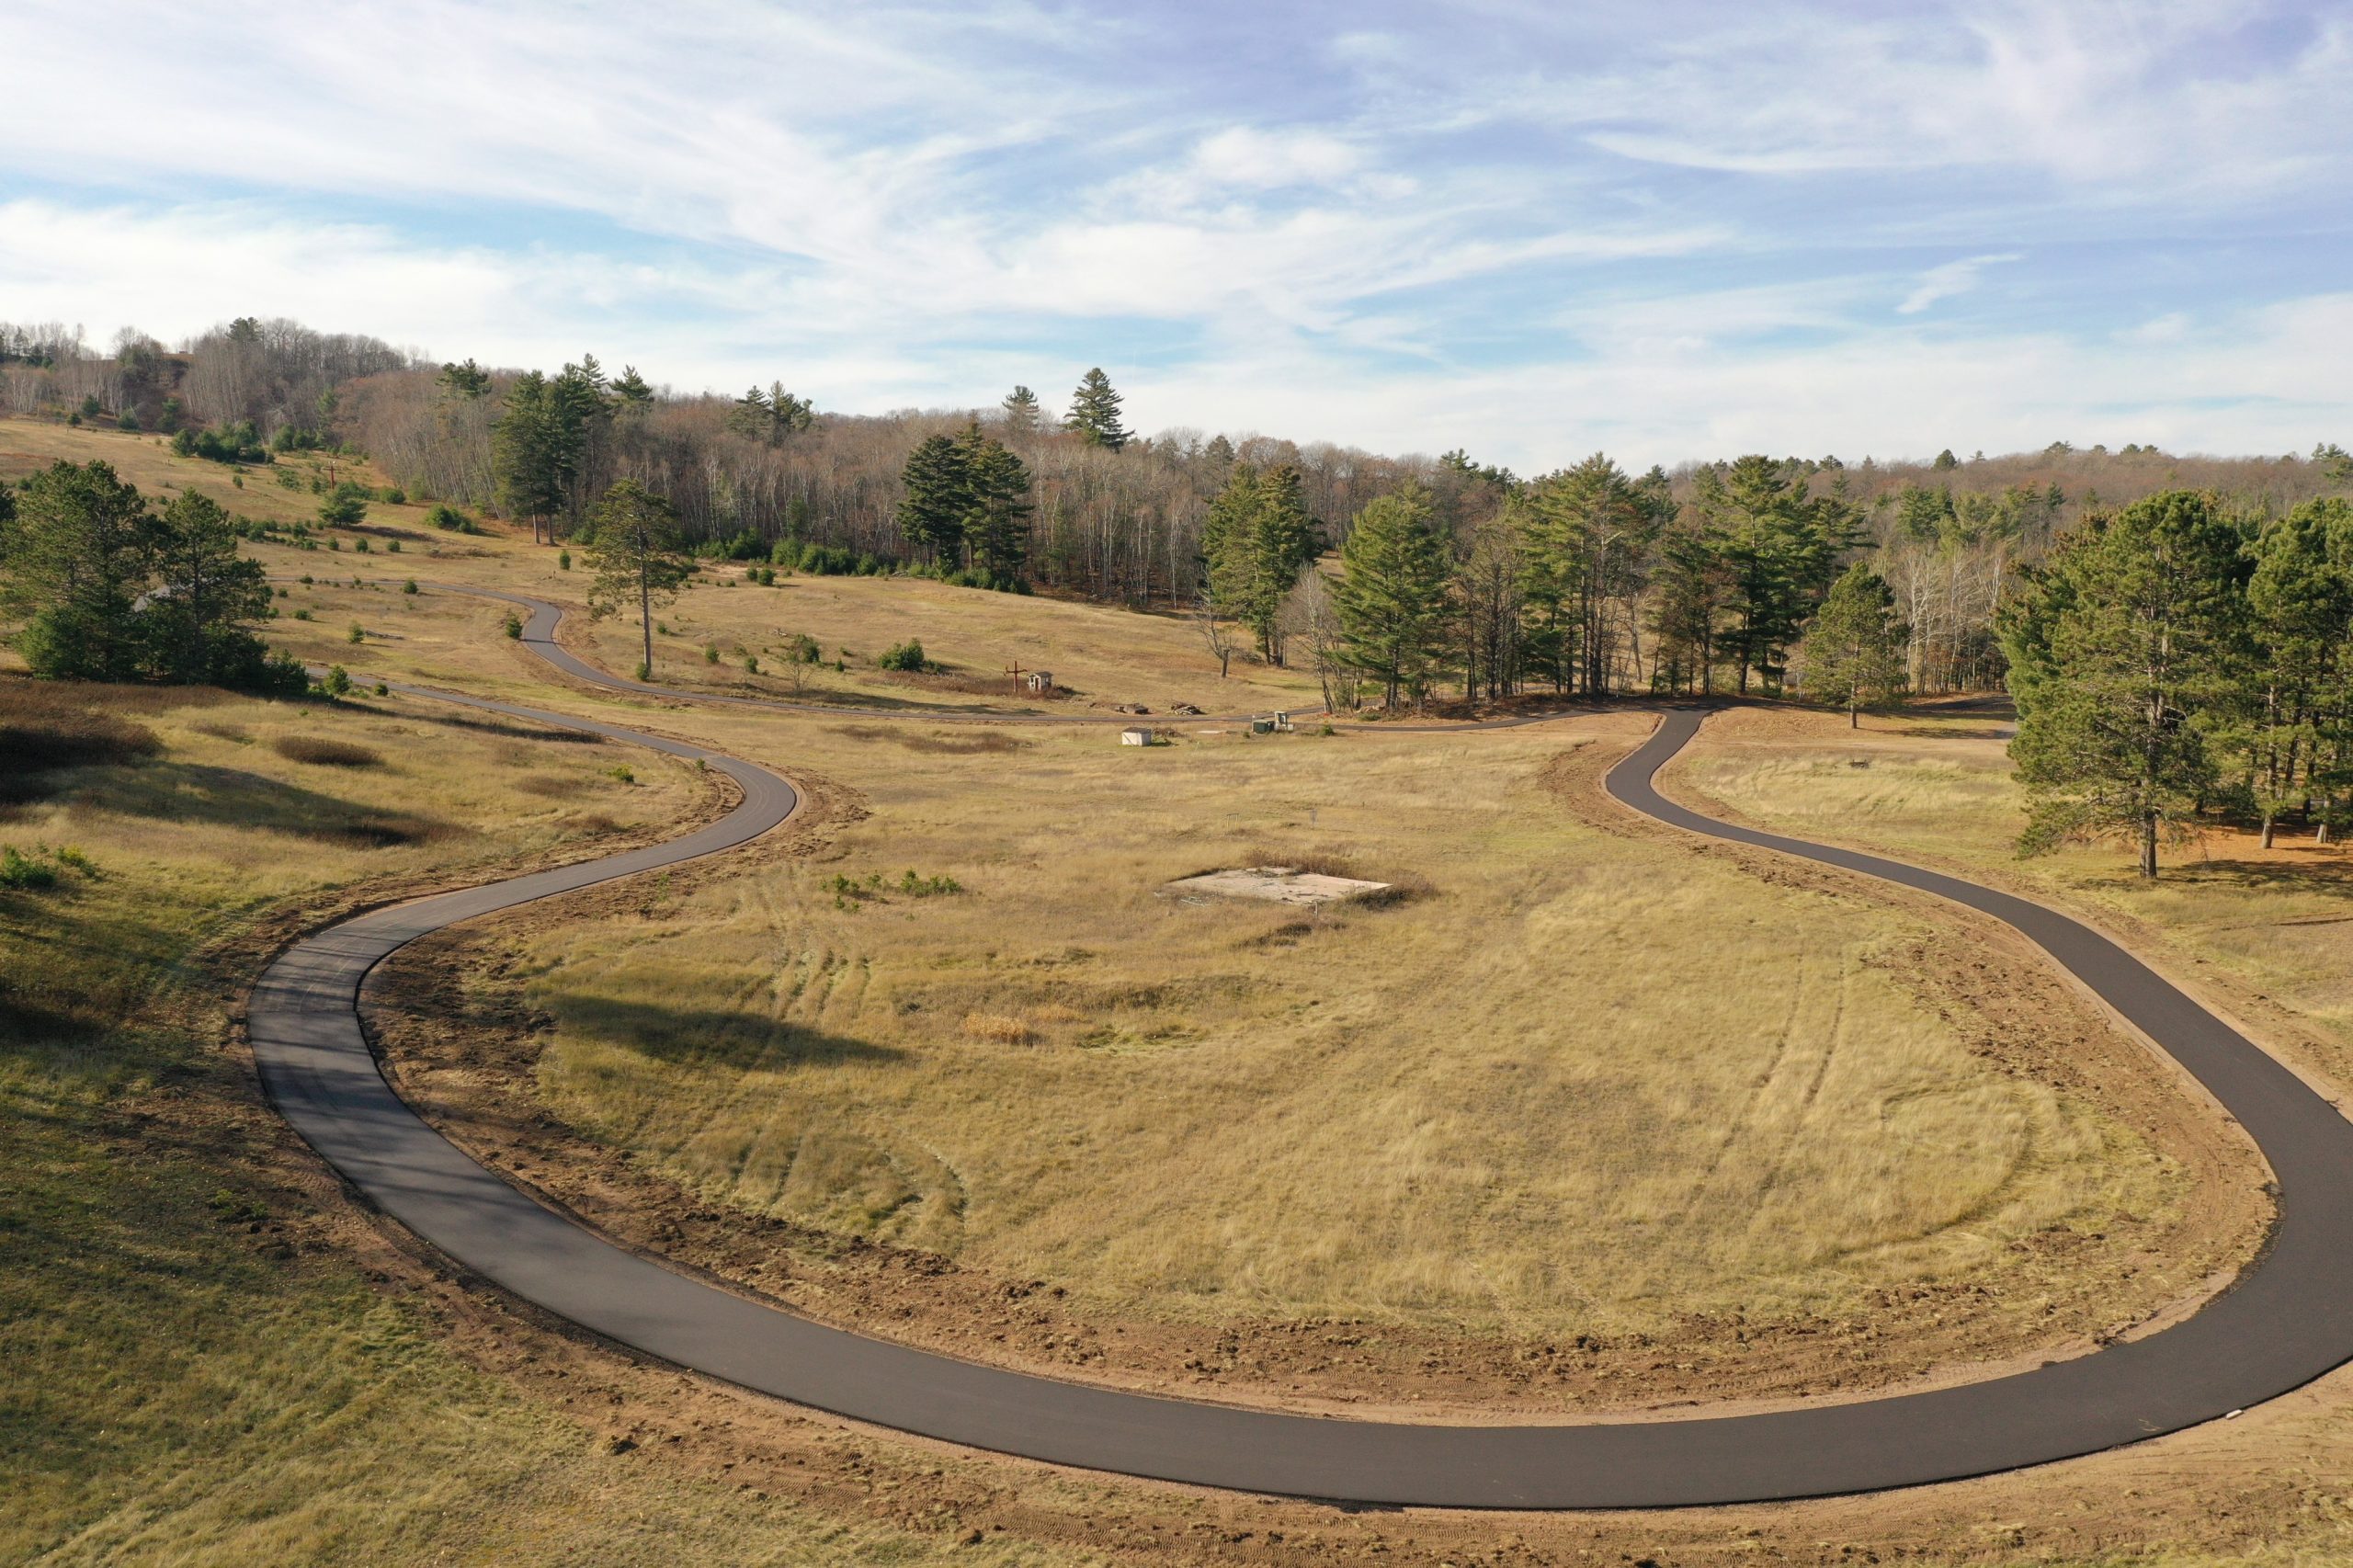
    The 5-kilometer paved rollerski loop at the base of Mt. Telemark, outside Cable, Wisconsin, when it was laid in 2023. A fixed loop like this is all a Zone 1 check needs: 45 to 60 minutes of laps, with lactate and heart rate taken after each one. (Photo: American Birkebeiner Ski Foundation)

    Checking Zone 1

    To confirm the accuracy of Zone 1, I have athletes do 45 to 60 minutes of work on a standard loop of about 15 to 20 minutes, and we take lactate measurements after each loop. If lactate and heart rate remain stable, we know the endurance Zone 1 training is in the correct range. A stable lactate response suggests that the intensity is easy enough, but it does not necessarily identify the first lactate threshold, or LT1.

    We need to understand that no method of determining training zones is precise. The body just doesn’t operate that way. For any training adaptation there is an optimal point of adaptation, but also a much broader range in which the adaptation occurs. So the objective when implementing training is to be as close to the optimal point as possible. But knowing where that is day in and day out is impossible, so being within a reasonable range is the goal.
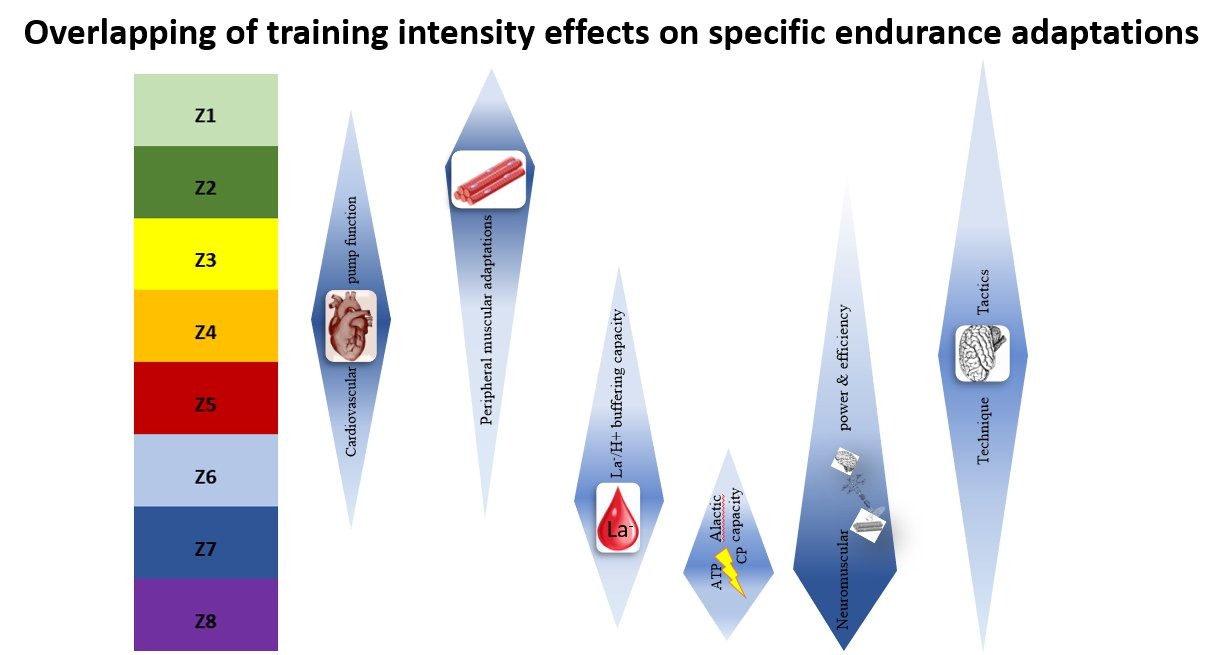
    Diagram of eight intensity zones beside overlapping shapes showing where cardiovascular, muscular, lactate buffering, alactic, neuromuscular and technical adaptations occur
    Every adaptation has an intensity where it responds best and a much wider range where it still responds. (Figure: redrawn from Olympiatoppen educational material, 2020)

    Close Enough

    My conclusion is that using field-testing measures along with training and race performance data to support training-zone determination is adequate, and it allows us to build ranges that can move as fitness changes. There are no ideal “thresholds” or clear metabolic points we can use to determine training zones. LT1 and the second lactate threshold, LT2, are useful reference points, but different protocols and definitions can produce different estimates for the same athlete.

    Other thresholds, determined by heart rate variability, DFA alpha1, respiration and muscle oxygen, may prove useful in the future, but so far they have not been fully validated and likewise cannot identify clear physiological thresholds.

    So we are left with what is practical and available to developing and recreational athletes. Let’s get close enough, control training effectively and learn what works based on the data for each athlete. Heart-rate metrics fit that need best.

    We can debate exactly where one training zone ends and another begins, but no test gives us a number that will describe an athlete perfectly every day. For the athletes I coach, heart rate gives us a practical place to start and a way to follow their response over time. I use field tests and race results to establish working ranges, then look at heart rate alongside pace, perceived effort, conditions and, when available, lactate. If those observations no longer agree, I revisit the zones.

    The goal is not to defend a particular method or number on a chart. It is to help an athlete do the work as intended on a given day, learn from the response and make a better decision the next time. That is where training zones earn their value.


    Help Support Our Coverage!

    If you value the thoughtful work and access FasterSkier provides, please consider becoming a Voluntary Subscriber. Your support directly fuels our work to cover the people, places, and moments that make our sport special.

    Join the FasterSkier community!
     

    Two skiers rollerskiing up a winding mountain road lined with yellow aspens
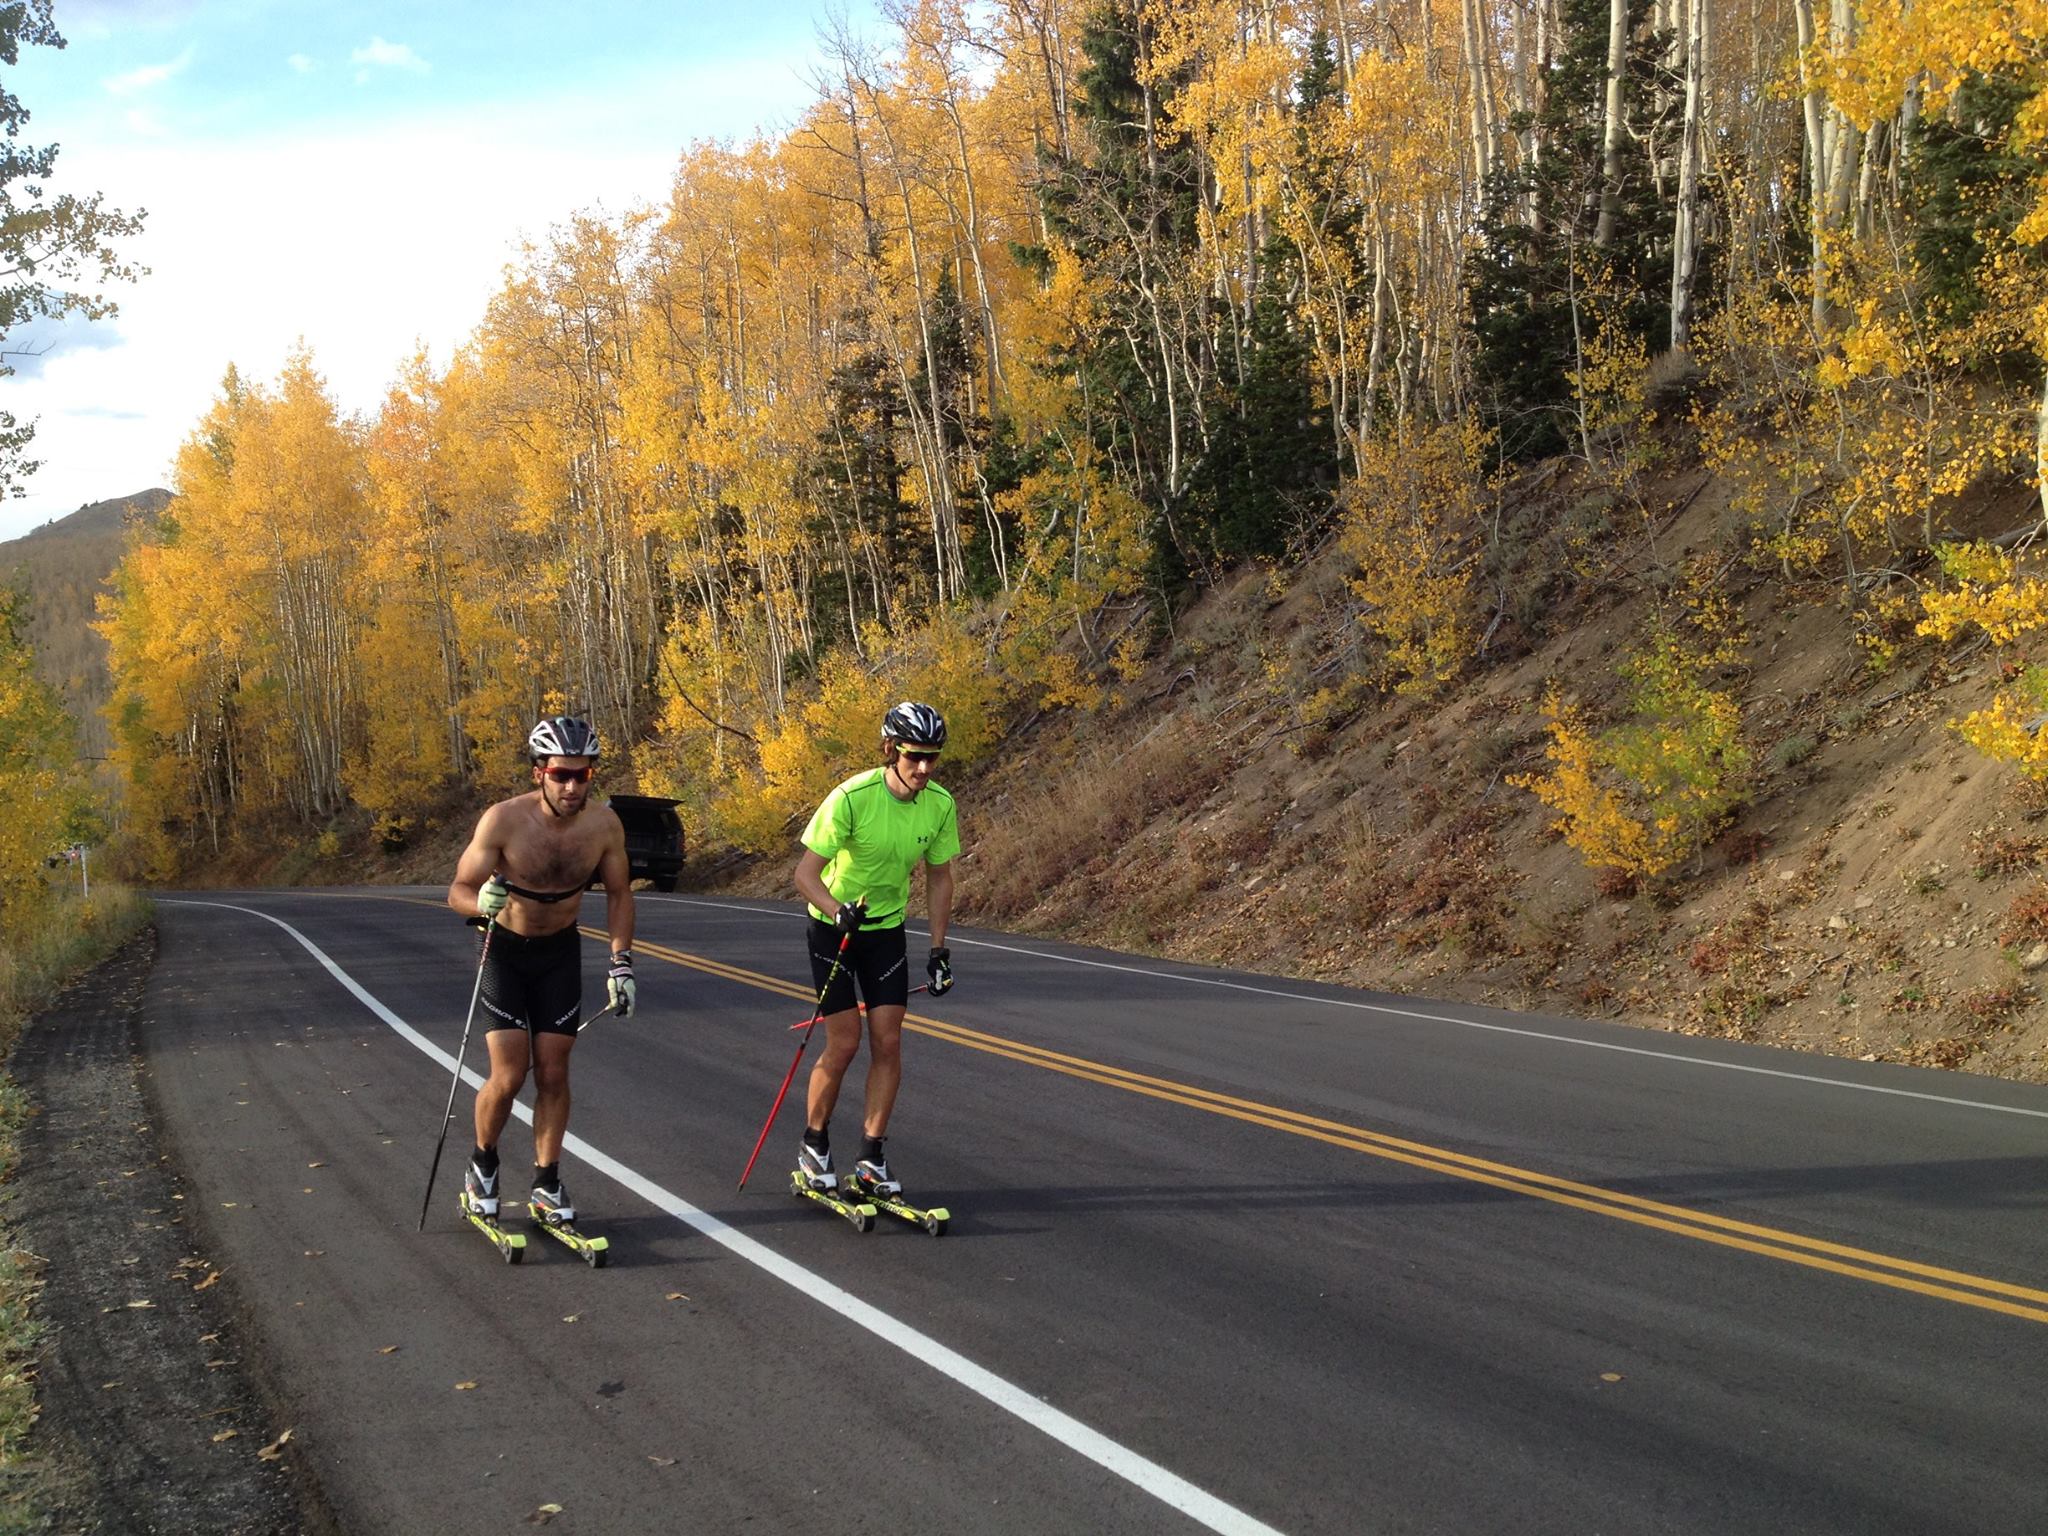
    Canadian biathletes Brendan Green and Scott Perras rollerskiing up Guardsman Pass above Park City, Utah, during a fall 2015 camp. (Photo: Matthias Ahrens)
  • Your Zone 2 May Be Someone Else’s Zone 1

    Your Zone 2 May Be Someone Else’s Zone 1

    This article was made possible through the generous support of our voluntary subscribers. If you value coverage like this, please support FasterSkier with a voluntary subscription.

    Thomas Stephen in a red and black Canada suit skating up a snowy slope with pines fading into fog
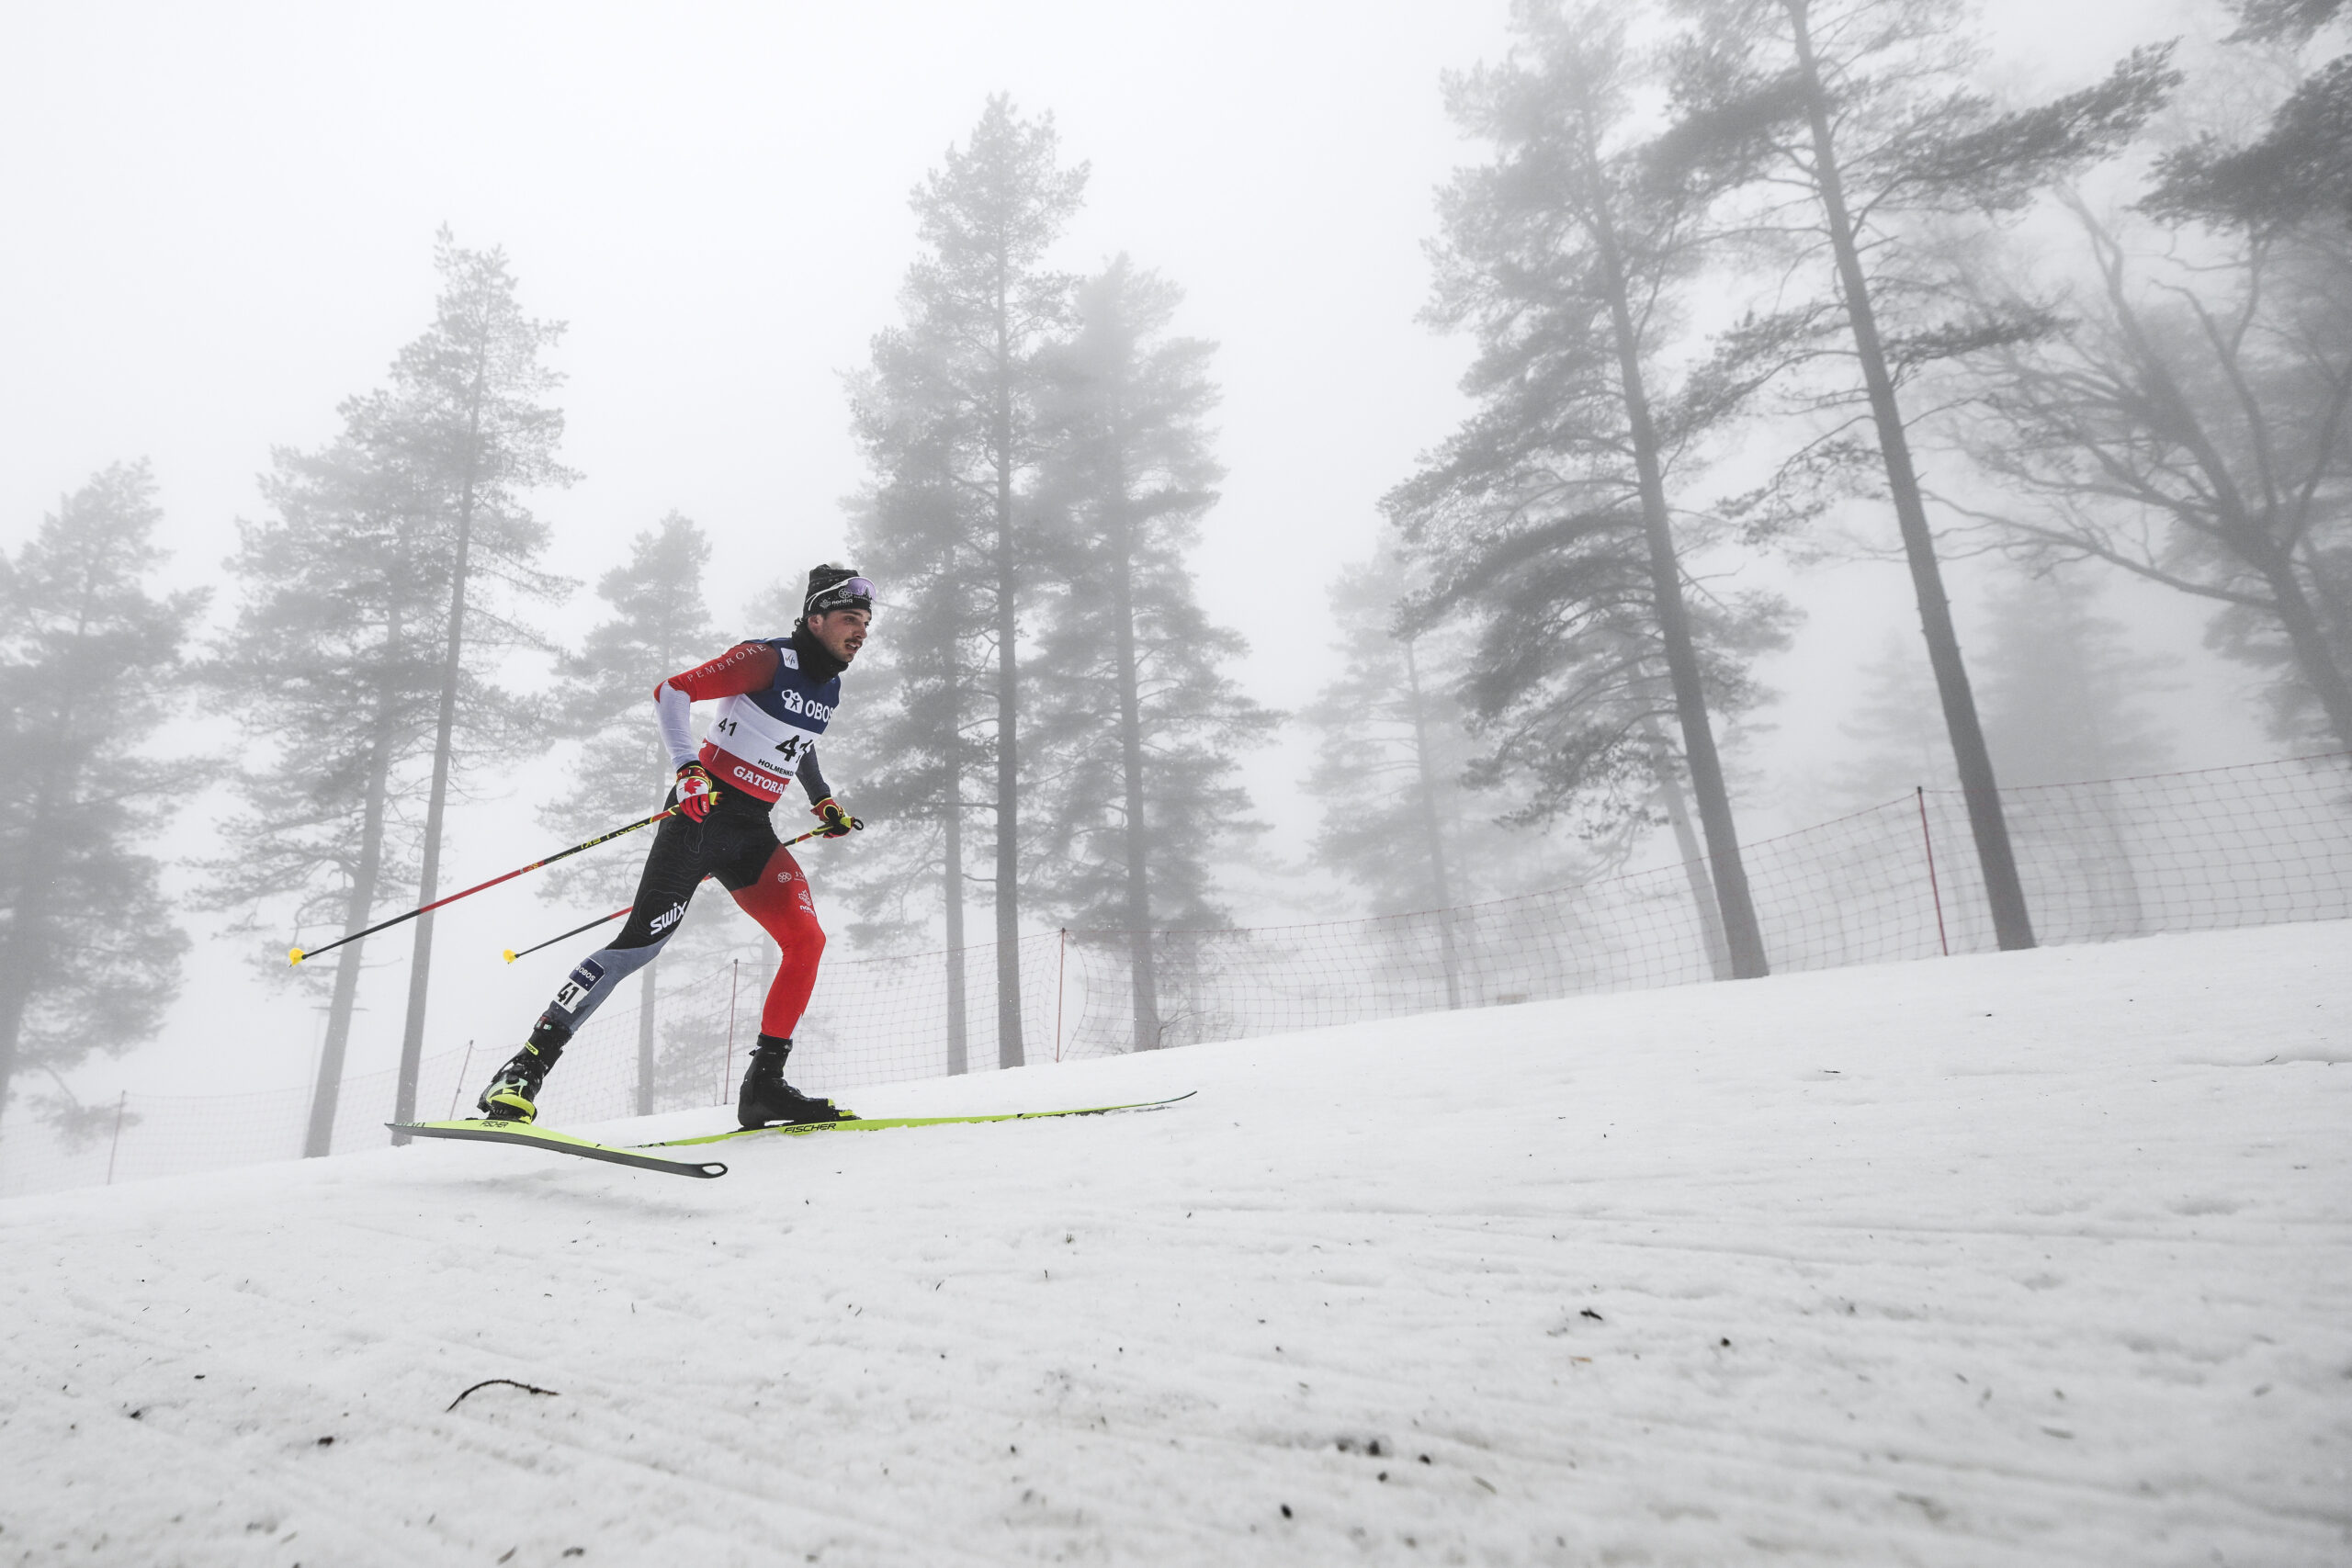
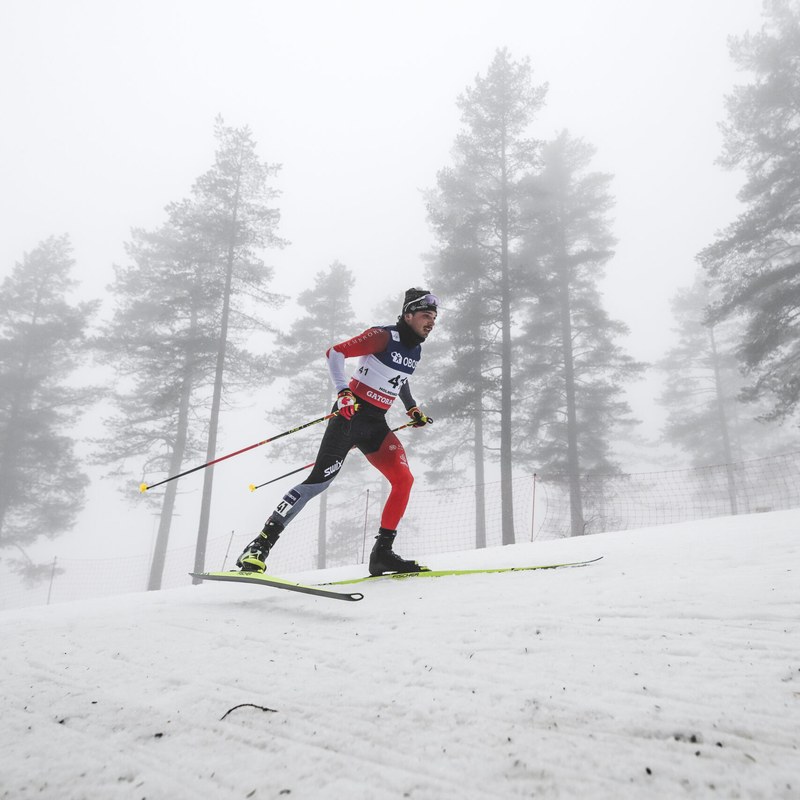
    Thomas Stephen of Canada in the fog at the Oslo World Cup mass start in March 2026. One coach’s Zone 2 can be another’s Zone 1, and the label means little until you know what it is anchored to. (Photo: Authamayou/NordicFocus)

    Over the last decade I have often thought that we need to find a better way to define training zones. I have assessed every model under the sun and even tried to create some new ones. From a metabolic perspective, three-zone models probably make the most sense, because physiological anchors form the transition points, even though some of those anchors, lactate threshold among them, are questionable. Then there are five- and seven-zone models. Which are best, and which are most accurate? The answer is probably none of them. They all have limitations, and there really is not a better method.

    Some coaches set training zones from maximal heart rate. Others use lactate measures referenced to heart rate, pace or power, and still others use gas analysis (ventilation, VO2, RER and so on). Whatever the method, the important point is how the zones are used and implemented in training. While there may be a valid physiological basis for training zones, their primary use is to quantify training as planned and as performed. That is how we assess which methods of training have worked for the individual athlete.

    Julia Kern in a U.S. suit and yellow bib skating toward the camera past a row of flags
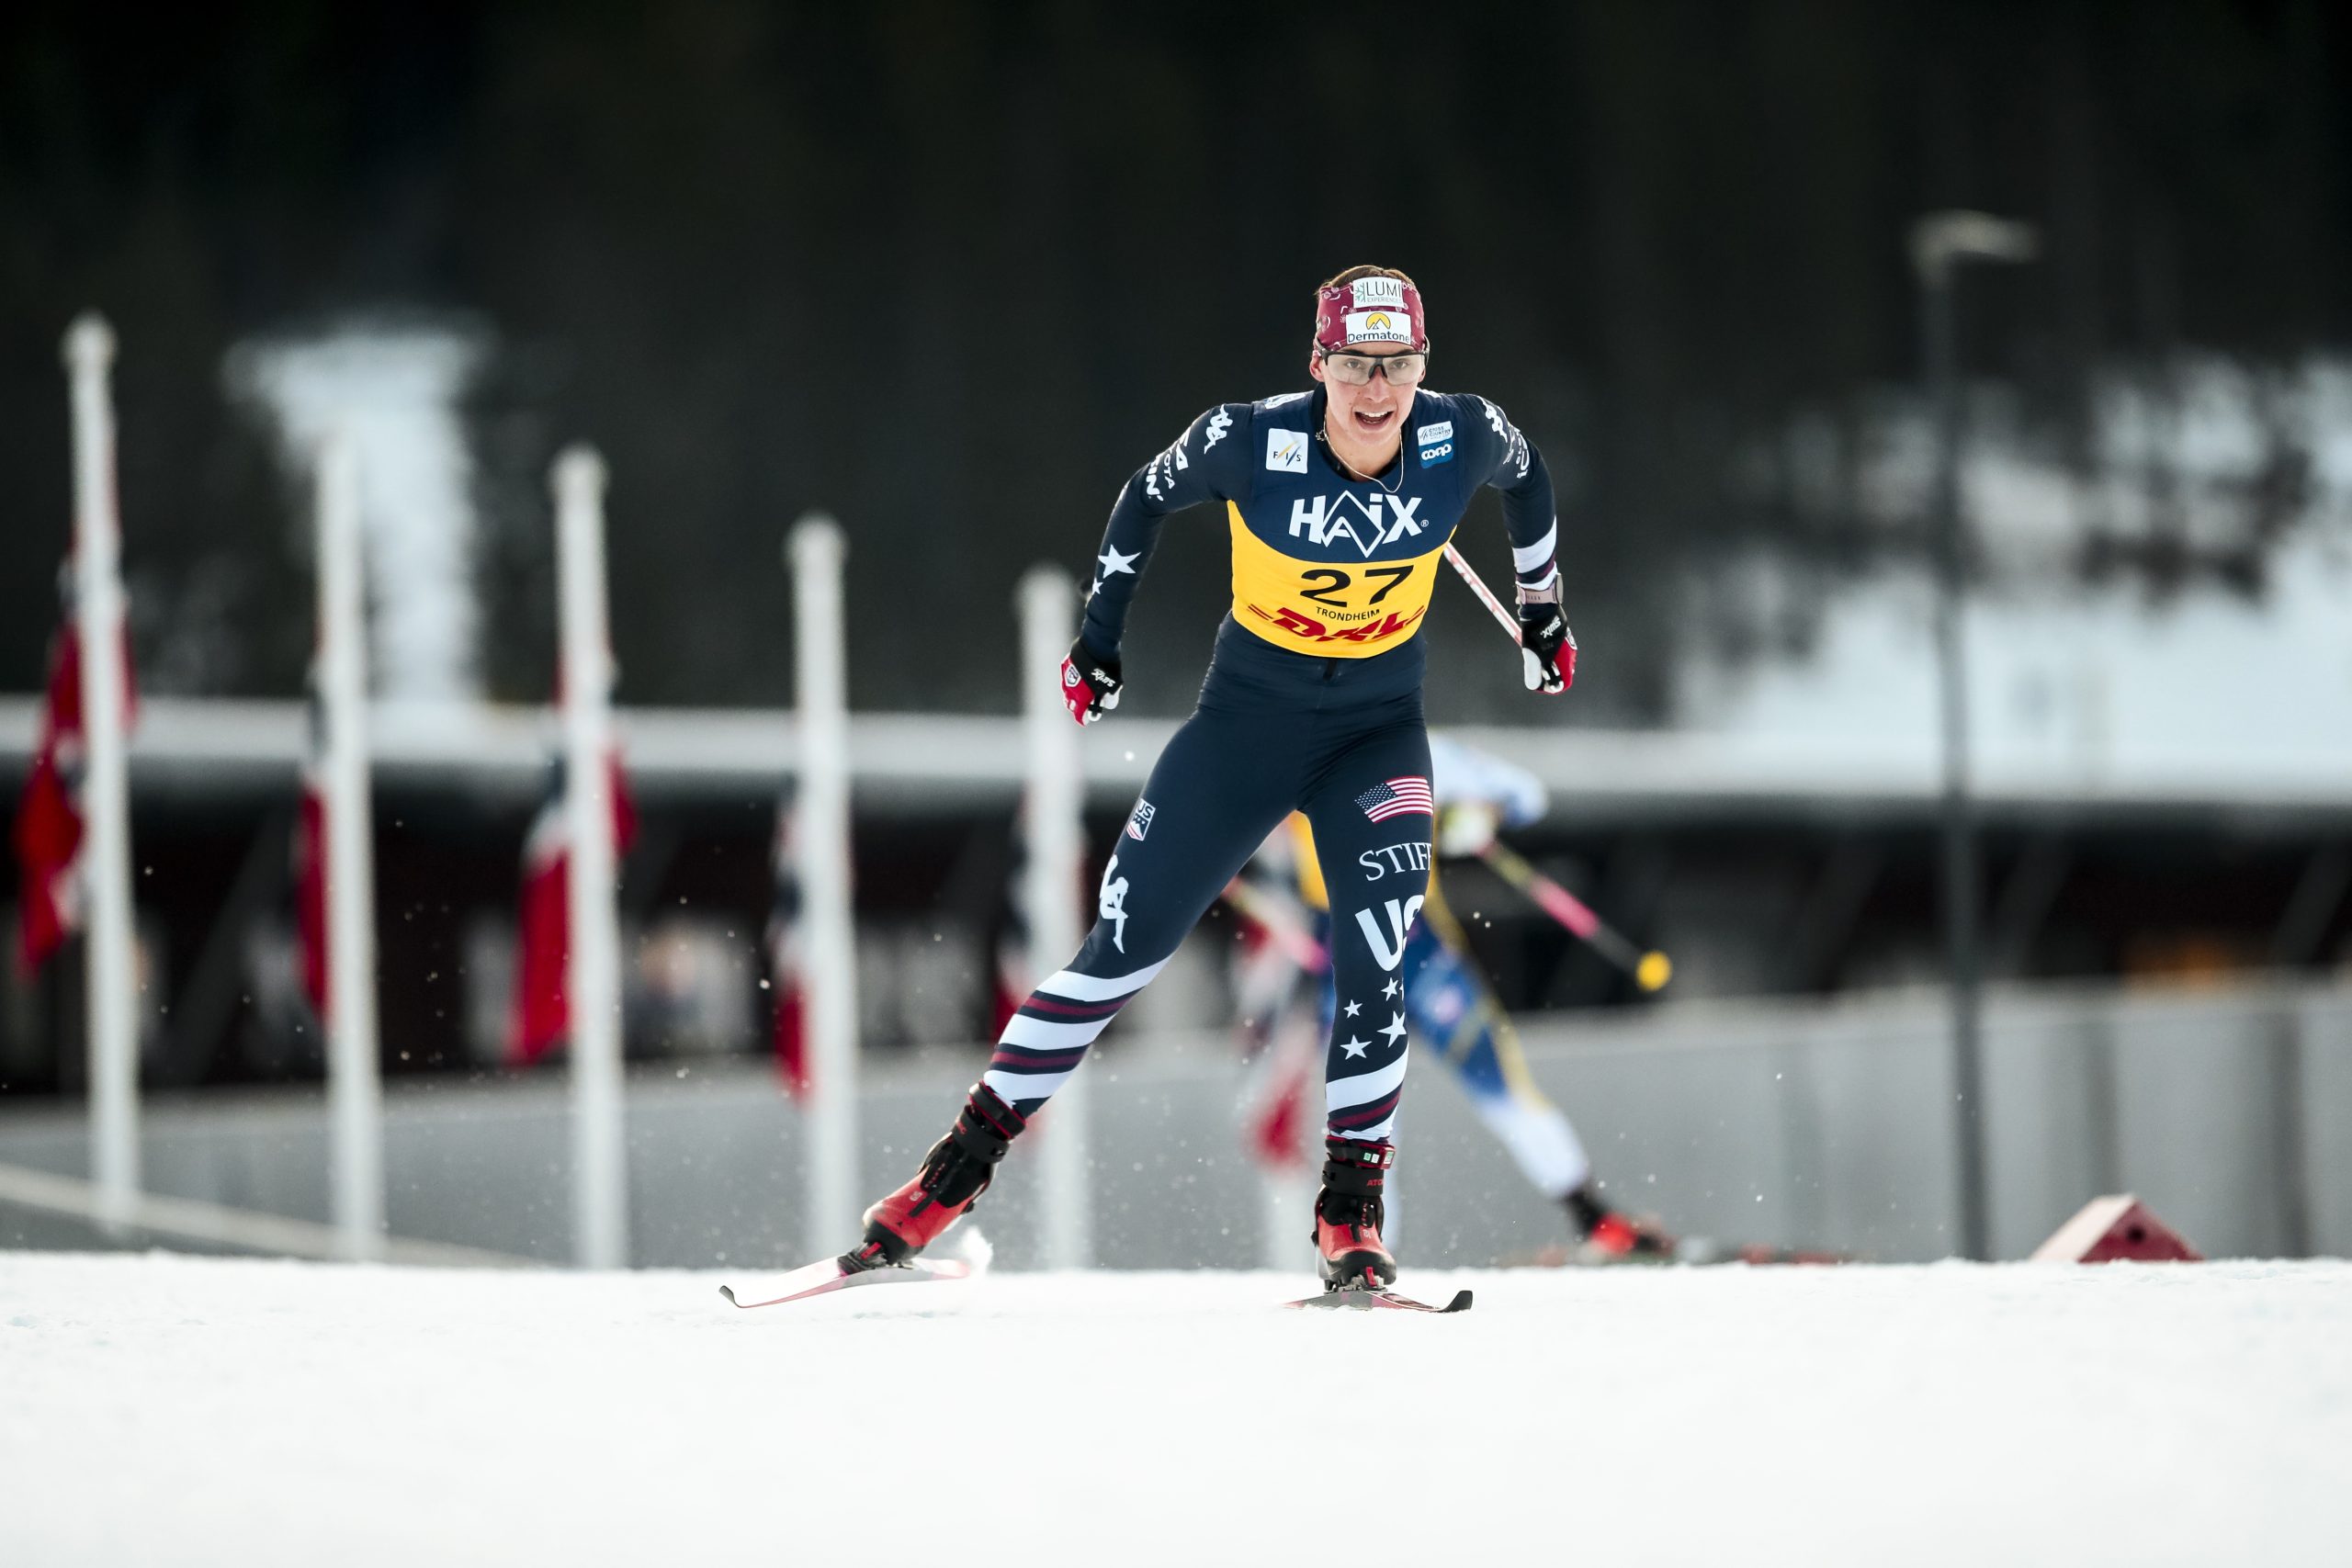
    Julia Kern racing the 10 k freestyle at the Trondheim World Cup in December 2025. A higher heart rate at a standard effort can reflect heat, glycogen depletion or fatigue, and all of those should change the day’s training. (Photo: Modica/NordicFocus)

    Heart Rate Holds Up

    Many coaches and even physiologists claim that heart rate is too variable to be used reliably for training control. Of course it is variable. Physiology varies daily with fatigue, recovery, hydration, glycogen status and more. In my experience, heart rate is no more variable than any other metric we use. We just don’t recognize the variation in the others, because it is not practical to measure them every day. Human physiology is complex, and in general heart rate reflects the current status of an athlete’s physiology. Under any system, it is important to train at a level that reflects the individual’s physiology and condition on that day. Heart rate is as good as anything for that, and I would argue better, because the daily variation is easy to assess.

    Heart rate is inexpensive, practical and physiologically informative. A higher heart rate at a standard workload can reflect warm weather, glycogen depletion or general fatigue, all of which matter when adjusting the day’s training. A lower heart rate at a standard workload often reflects improved fitness, though occasionally it can also reflect fatigue and increased parasympathetic drive of the autonomic nervous system.

    Table of five training intensity zones with Borg scale, RPE, percent of maximum heart rate, lactate, heart rate, breathing and speed for each
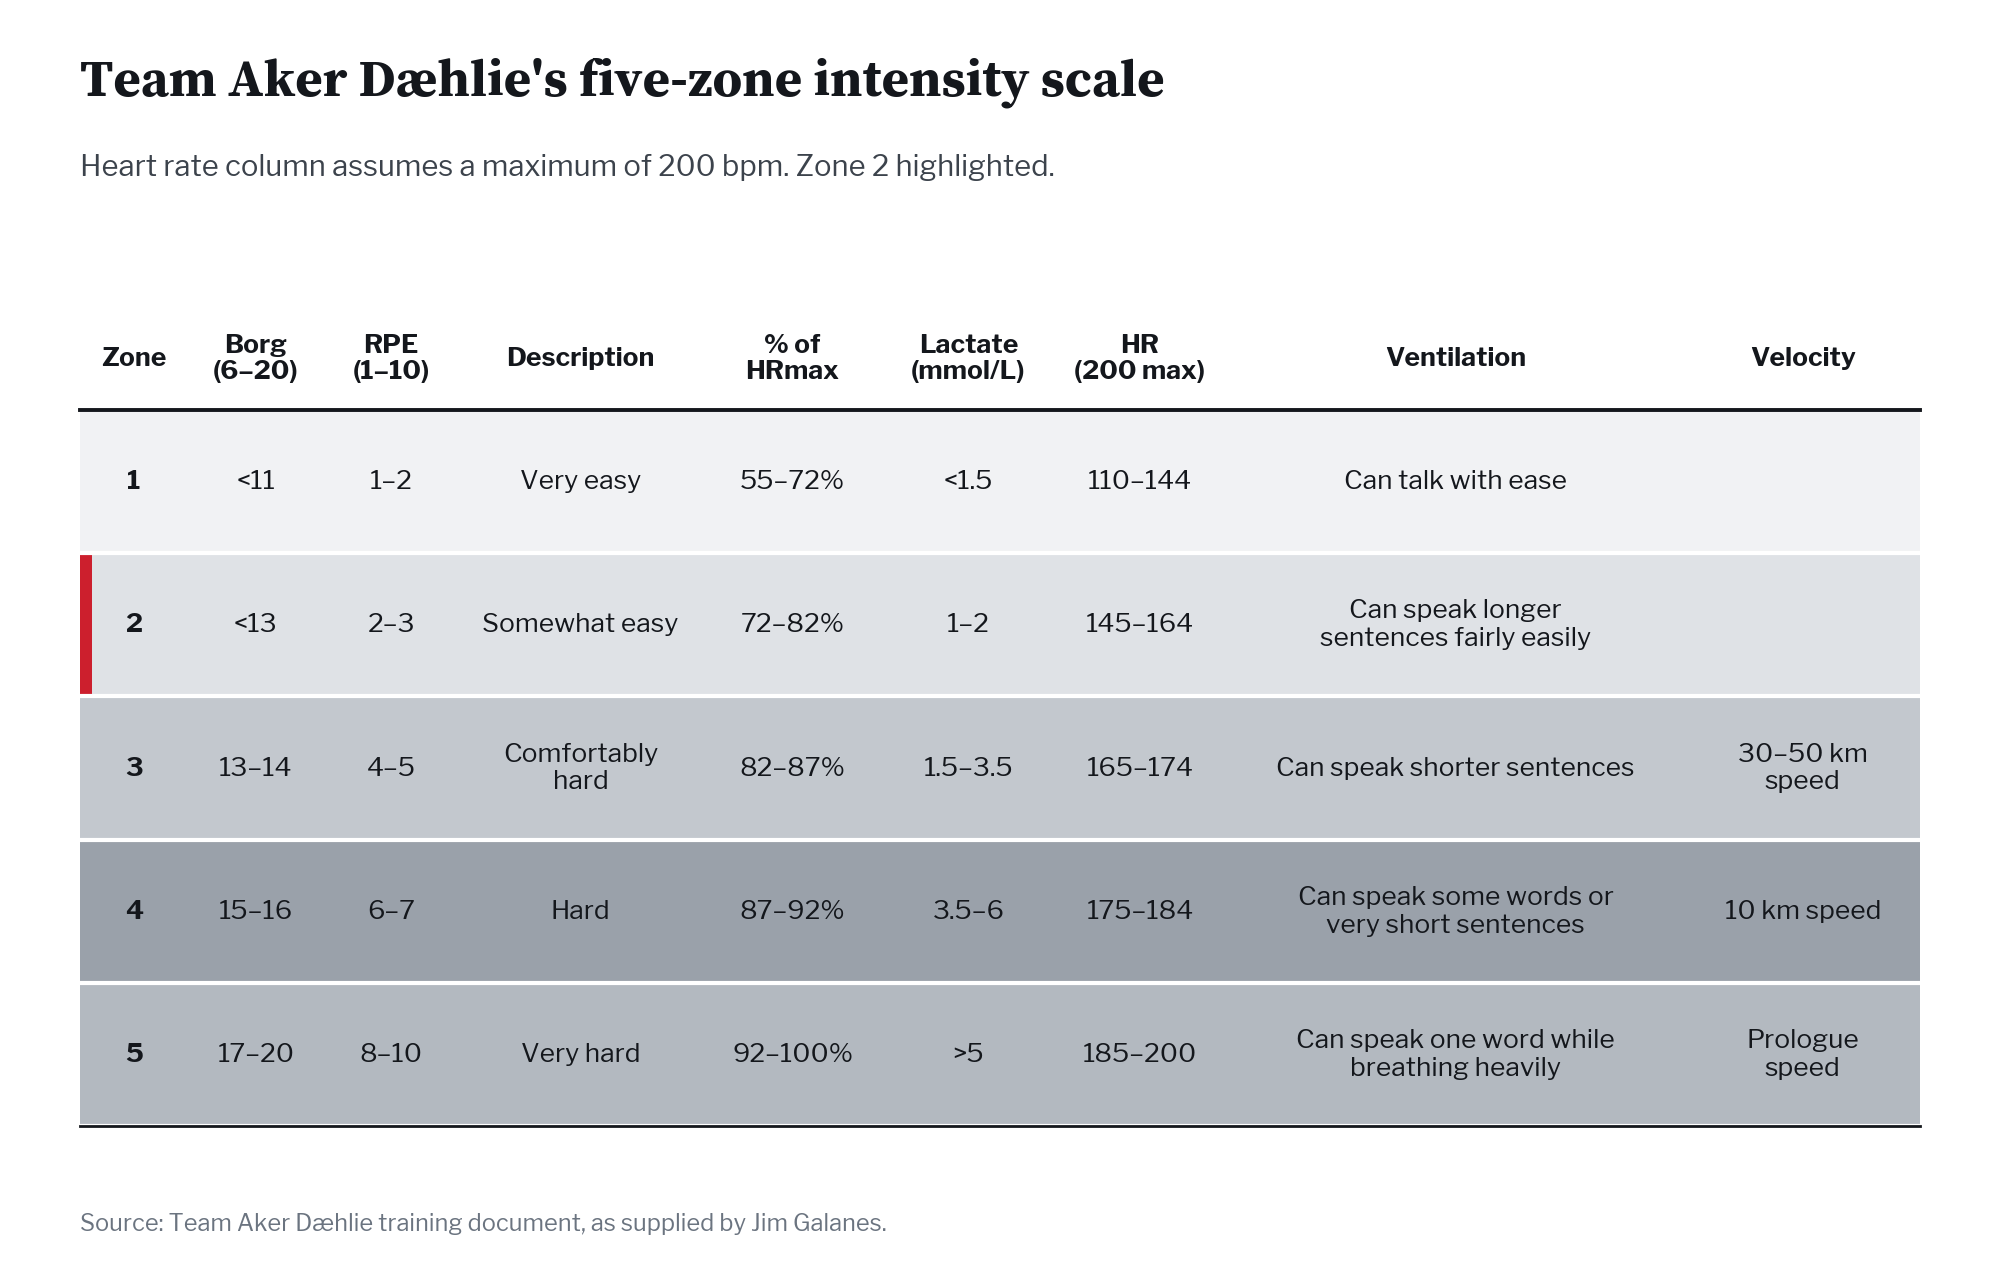
    Team Aker Dæhlie’s five-zone scale. Its Zone 2 runs from 1 to 2 mmol/L of lactate, overlapping Zone 1, which sits below 1.5. (Chart: FasterSkier)

    Whose Zone 2?

    One example is a document published a few years ago by Team Aker Dæhlie in Norway, which laid out a slightly different training zone model than I was used to seeing out of Norway. Given the popularity of Zone 2 training, I believe it is important to understand how the proponents of a particular system of training define and use their zones.

    In the Aker Dæhlie system there is significant overlap between Zones 1 and 2 in terms of lactate, with Zone 1 below 1.5 mmol/L and Zone 2 at 1 to 2 mmol/L, while the heart rate ranges are what I consider consistent with how most training zones are delineated. The implication of that lactate range is that lactate is highly variable and not the same between individuals. From the published document we can see that their Zone 2 does not fit what some may consider Zone 2. It fits how I would describe Zone 1: endurance training not to exceed 70 to 75 percent of maximal heart rate. We need to realize that lactate may vary greatly from day to day and can’t be viewed as a hard and fast anchor for a specific training zone.

    Listening to many podcasts and reading many articles and publications, I hear people discuss training zones as if they were talking about the same thing. Most often they are not. The recent popularity of Zone 2 training is a good example: what Iñigo San Millán means by Zone 2, many of the common five-zone models would define as Zone 1.

    So if you want to use and reference the Aker Dæhlie zone system, you should also be aware of this statement about Zone 2 in their published document:

    Zone 2: Semi-hard long sessions with a heart rate at around 140-155 bpm and with lactate up to 2 mmol/L, is considered intensity 2 training. Scholars debate over the importance of this training. In our experience, this training costs more than it is worth, and should therefore not be prioritized. L2 can work well to learn/automate correct technique. Again, evaluate cost vs benefit! Typical length of a session is 1 to 3 hours of continuous activity.

    Zones 3, 4 and 5 are close to how many would describe training in those ranges, although Zone 3 here may sit a bit lower than it is often described. But the Aker Dæhlie team is primarily a long-distance team, and we don’t know whether they use different zone ranges for World Cup skiers, or whether World Cup skiers do more of their intensive training in Zone 4.

    Stacked bar chart of monthly low, moderate and high intensity training hours across general preparation, specific preparation and competition phases
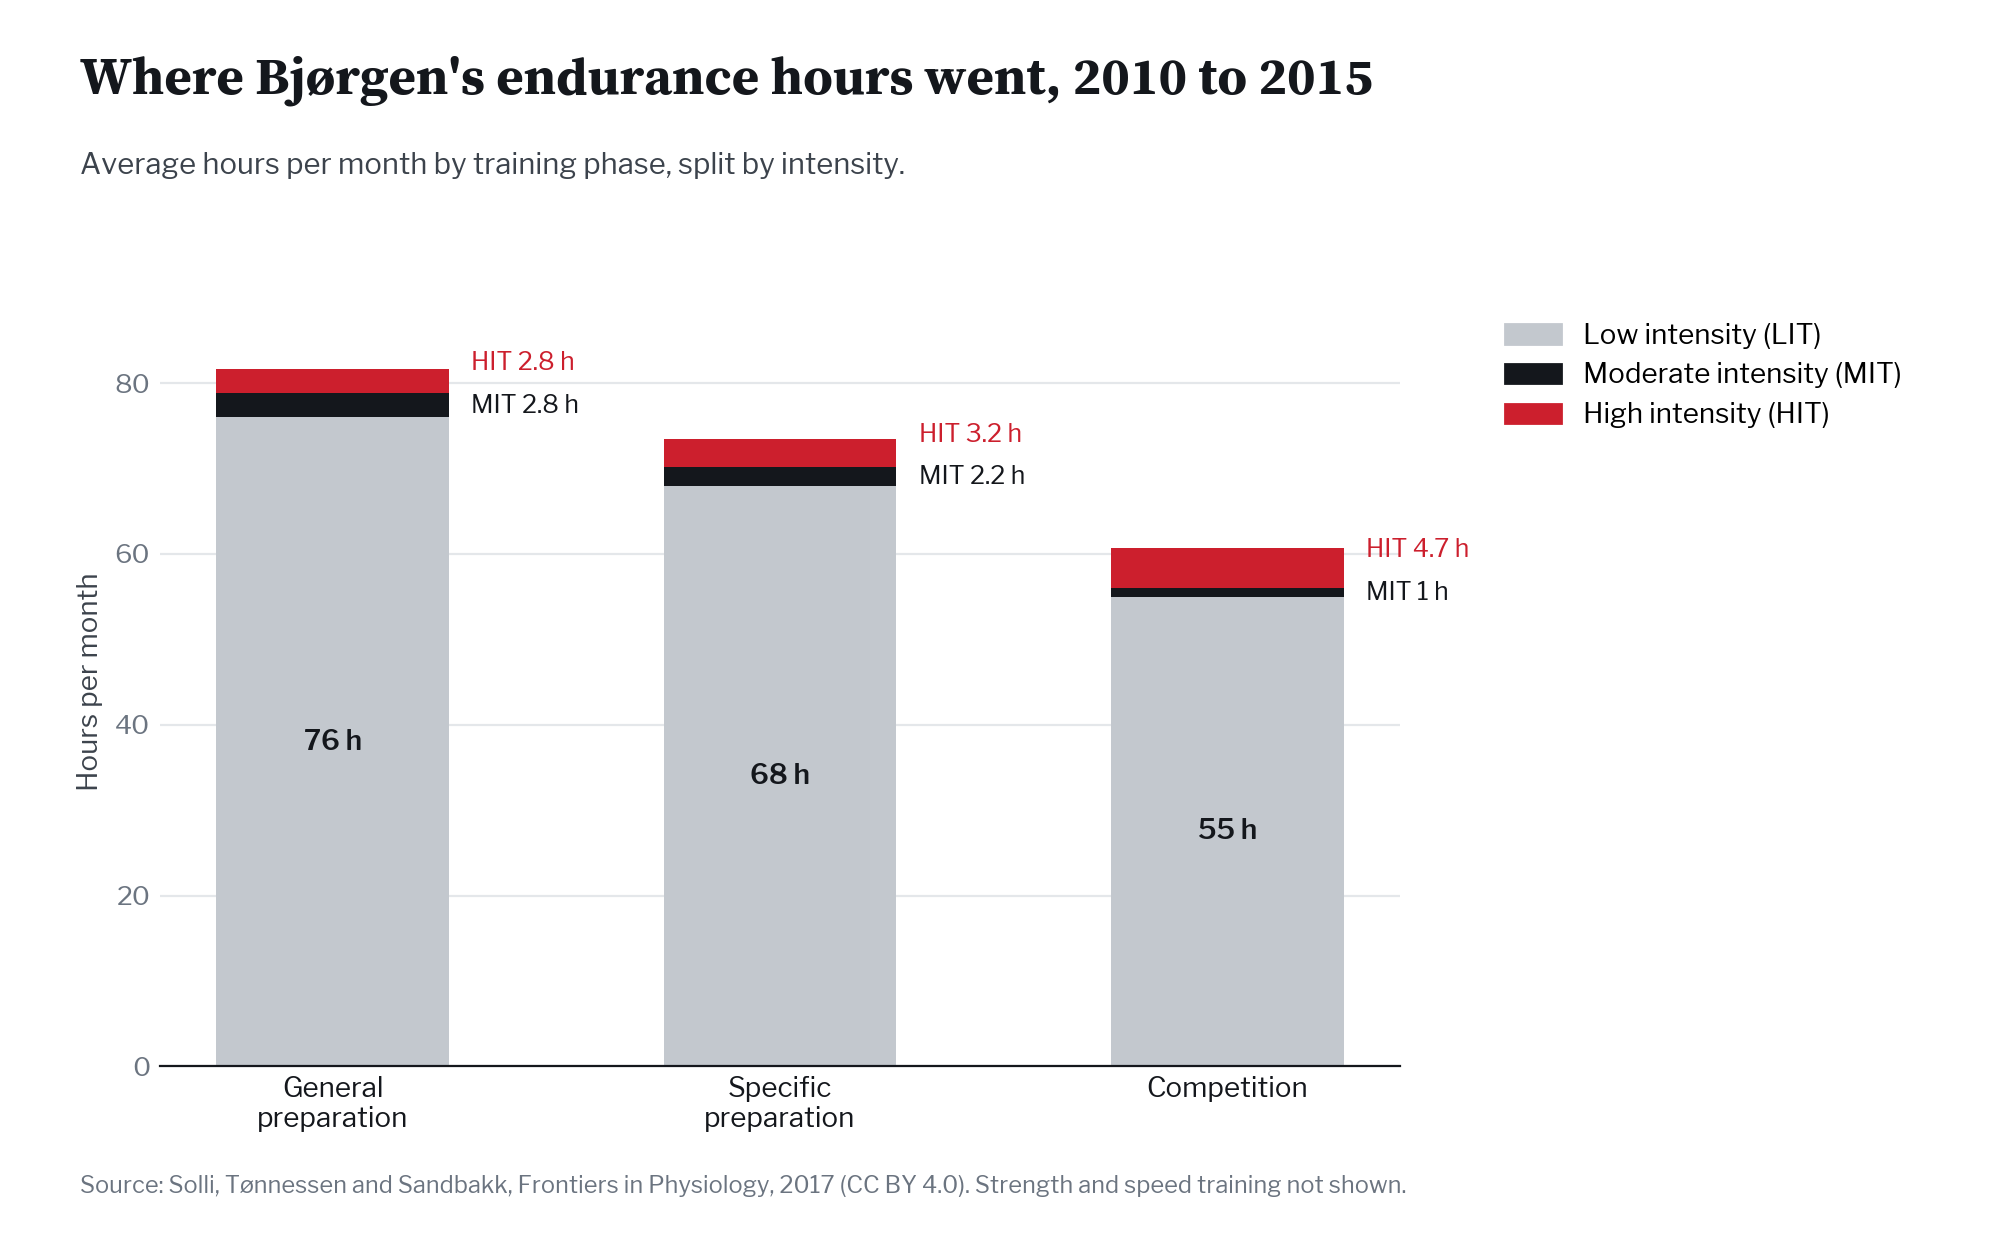
    Marit Bjørgen’s average monthly endurance hours by phase during her most successful seasons. (Chart: FasterSkier. Data: Solli, Tønnessen and Sandbakk, Frontiers in Physiology, 2017)

    How Bjørgen Trained

    A chart like the one above is often used to illustrate how one of the best female cross-country skiers ever trained during her most successful years. The data comes from an extensive study of Marit Bjørgen’s training.

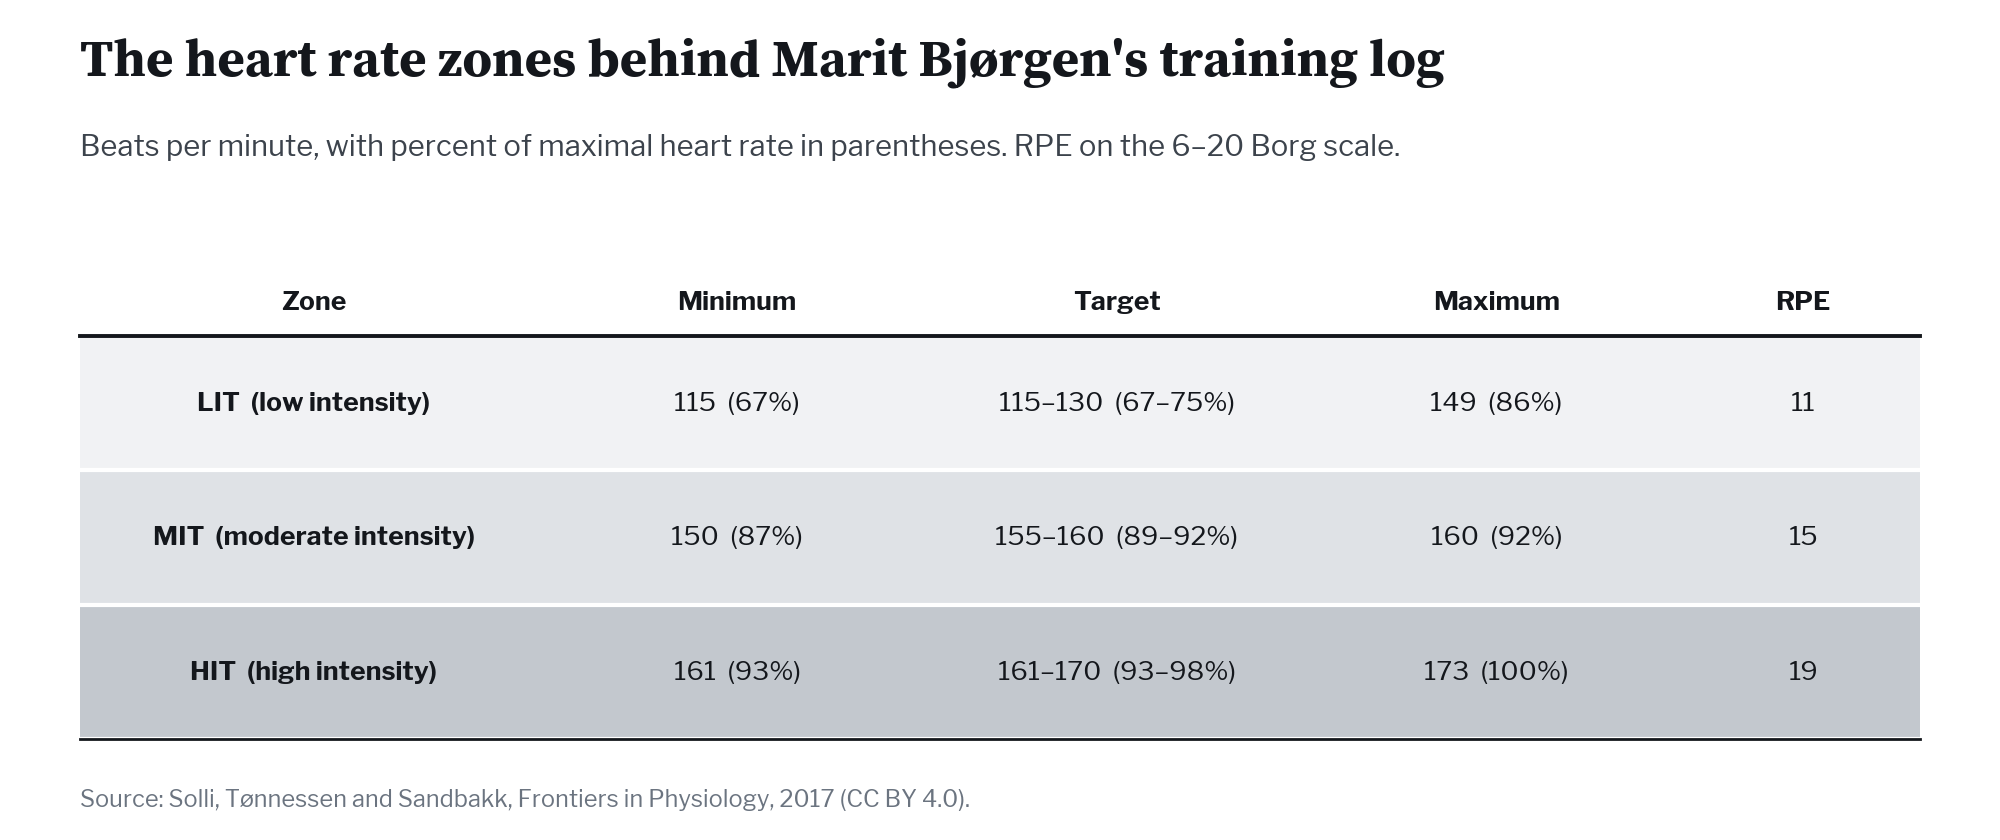
    Table of low, moderate and high intensity heart rate zones with minimum, target and maximum beats per minute and RPE
    The zones used to classify Bjørgen’s training. The top of the low-intensity target and the bottom of the moderate-intensity target sit 25 beats apart. (Chart: FasterSkier. Data: Solli, Tønnessen and Sandbakk, Frontiers in Physiology, 2017)

    A 25-Beat Gap

    To provide context, these are the zones used to define this athlete’s low-intensity (LIT), moderate-intensity (MIT) and high-intensity (HIT) training. The low-intensity target is where we might expect it, at 67 to 75 percent of maximal heart rate. However, there is a large gap, some 25 beats per minute, between the low- and moderate-intensity targets, with the MIT target at 89 to 92 percent of maximal heart rate. That MIT zone is quite different from what is described in the Aker Dæhlie document.

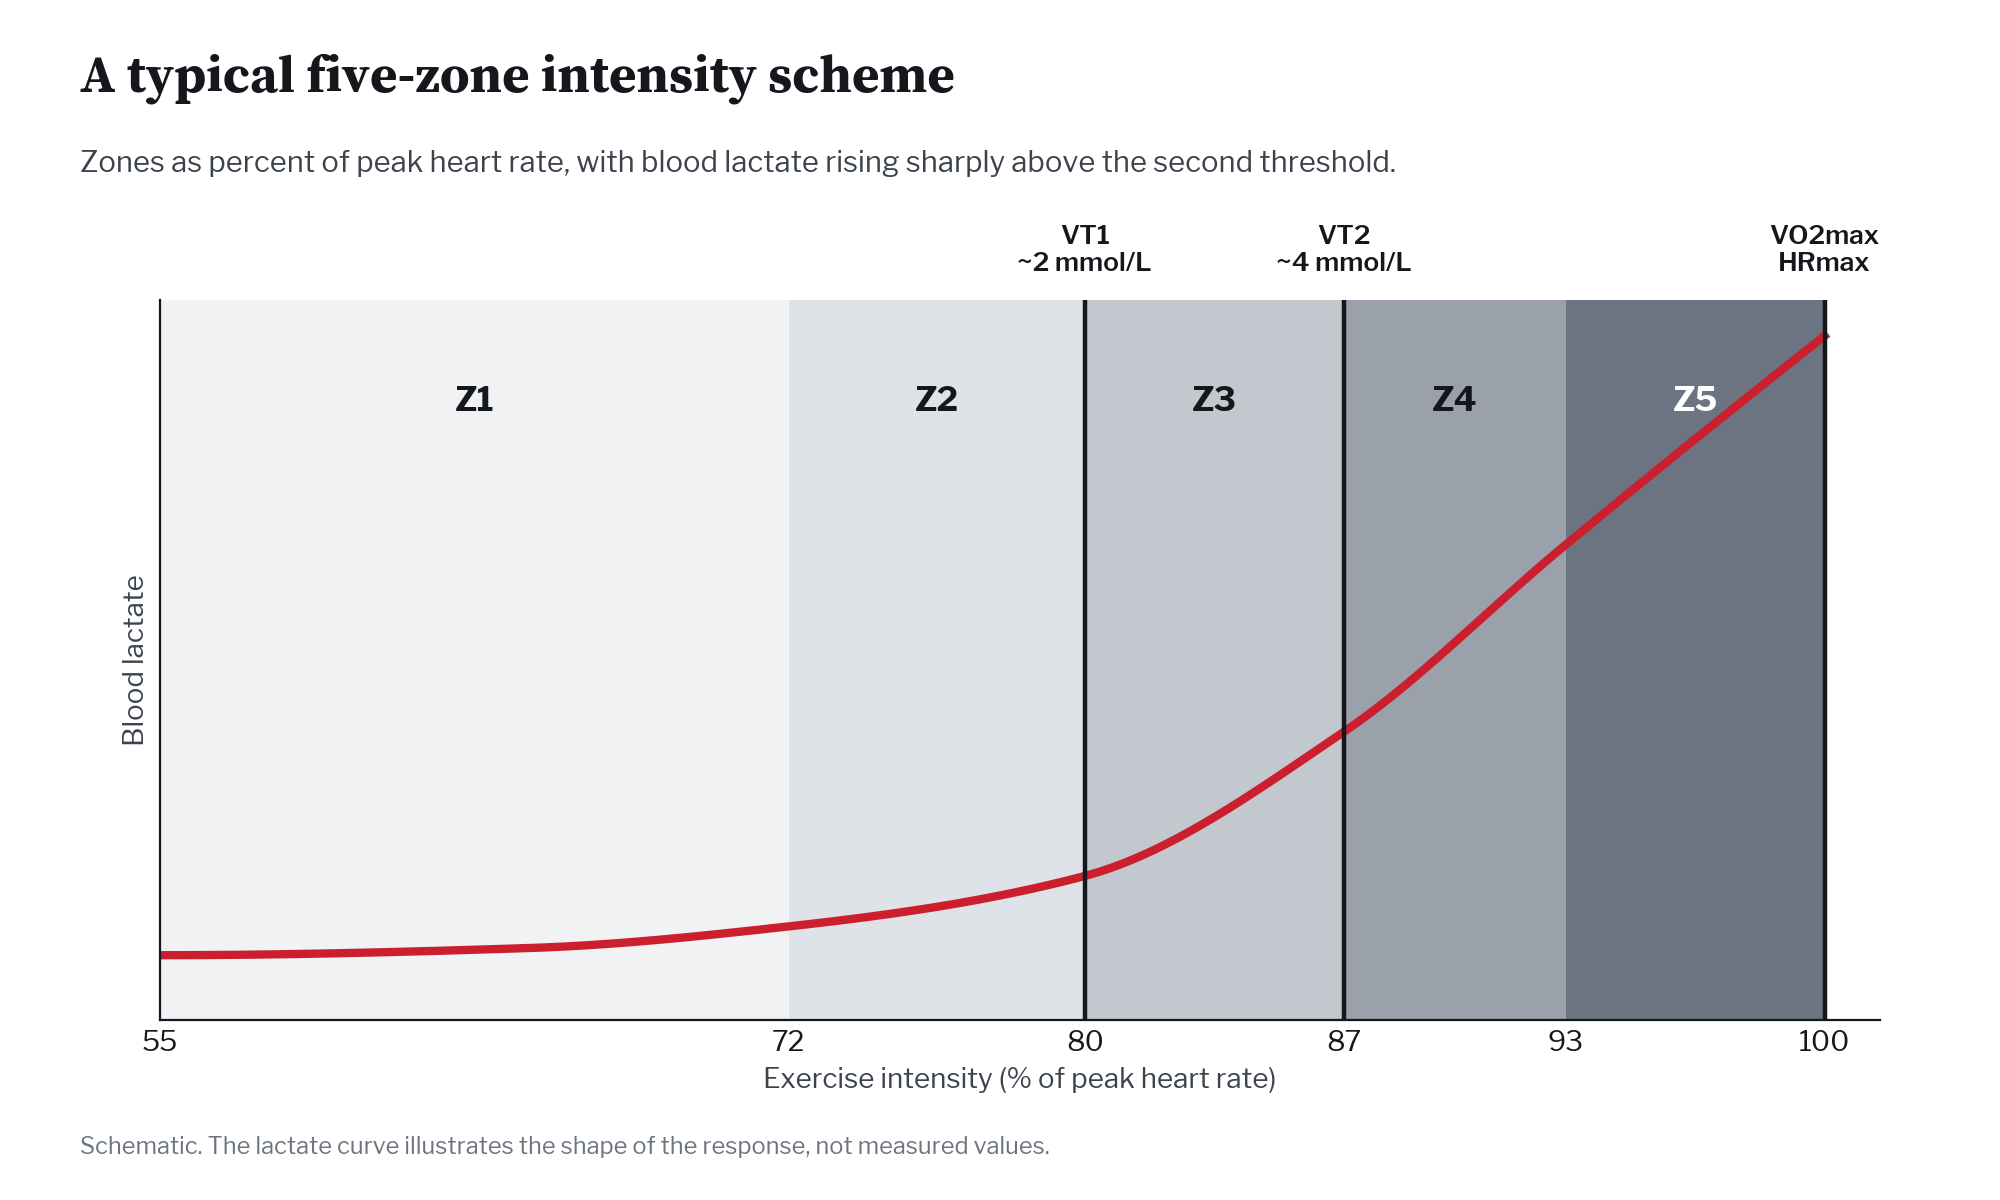
    Diagram of five heart rate zones from 55 to 100 percent of peak heart rate with a blood lactate curve rising steeply above the second threshold
    A typical five-zone scheme places the first ventilatory threshold at about 80 percent of peak heart rate. For most athletes, Galanes argues, it sits lower. (Chart: FasterSkier)

    Another Common Model

    Here is another example, much like the zone table published by Aker Dæhlie. It is a good theoretical model, but again I would suggest that endurance training above 75 percent of maximal heart rate is unnecessary, and the cost-benefit assessment does not suggest a benefit. We also see that LT1/VT1 is probably not at 80 percent of maximal heart rate for most athletes.

    Diagram of eight intensity zones beside overlapping shapes showing where cardiovascular, muscular, lactate buffering, alactic, neuromuscular and technical adaptations occur
    Each adaptation has an intensity where it responds best, but none of them stops at a zone boundary. (Figure: redrawn from Olympiatoppen educational material, 2020)

    Zones Overlap

    Most of us consider training zones hard and fast, but that is not the case. The chart above illustrates the possible range of metabolic and neuromuscular benefits of different training intensities. I believe the reason to use zones and monitor training is to ensure effective training adaptation. That is why I say that endurance training at more than 70 to 75 percent of maximal heart rate does not have a positive cost-benefit. As recovery time increases, adaptation slows, and the time to readiness for the next hard session can be extended.

    The chart is an excellent depiction of how adaptations overlap across training intensities. Each metabolic and neuromuscular adaptation has a theoretical optimal range, but the adaptations still occur well outside those ranges.

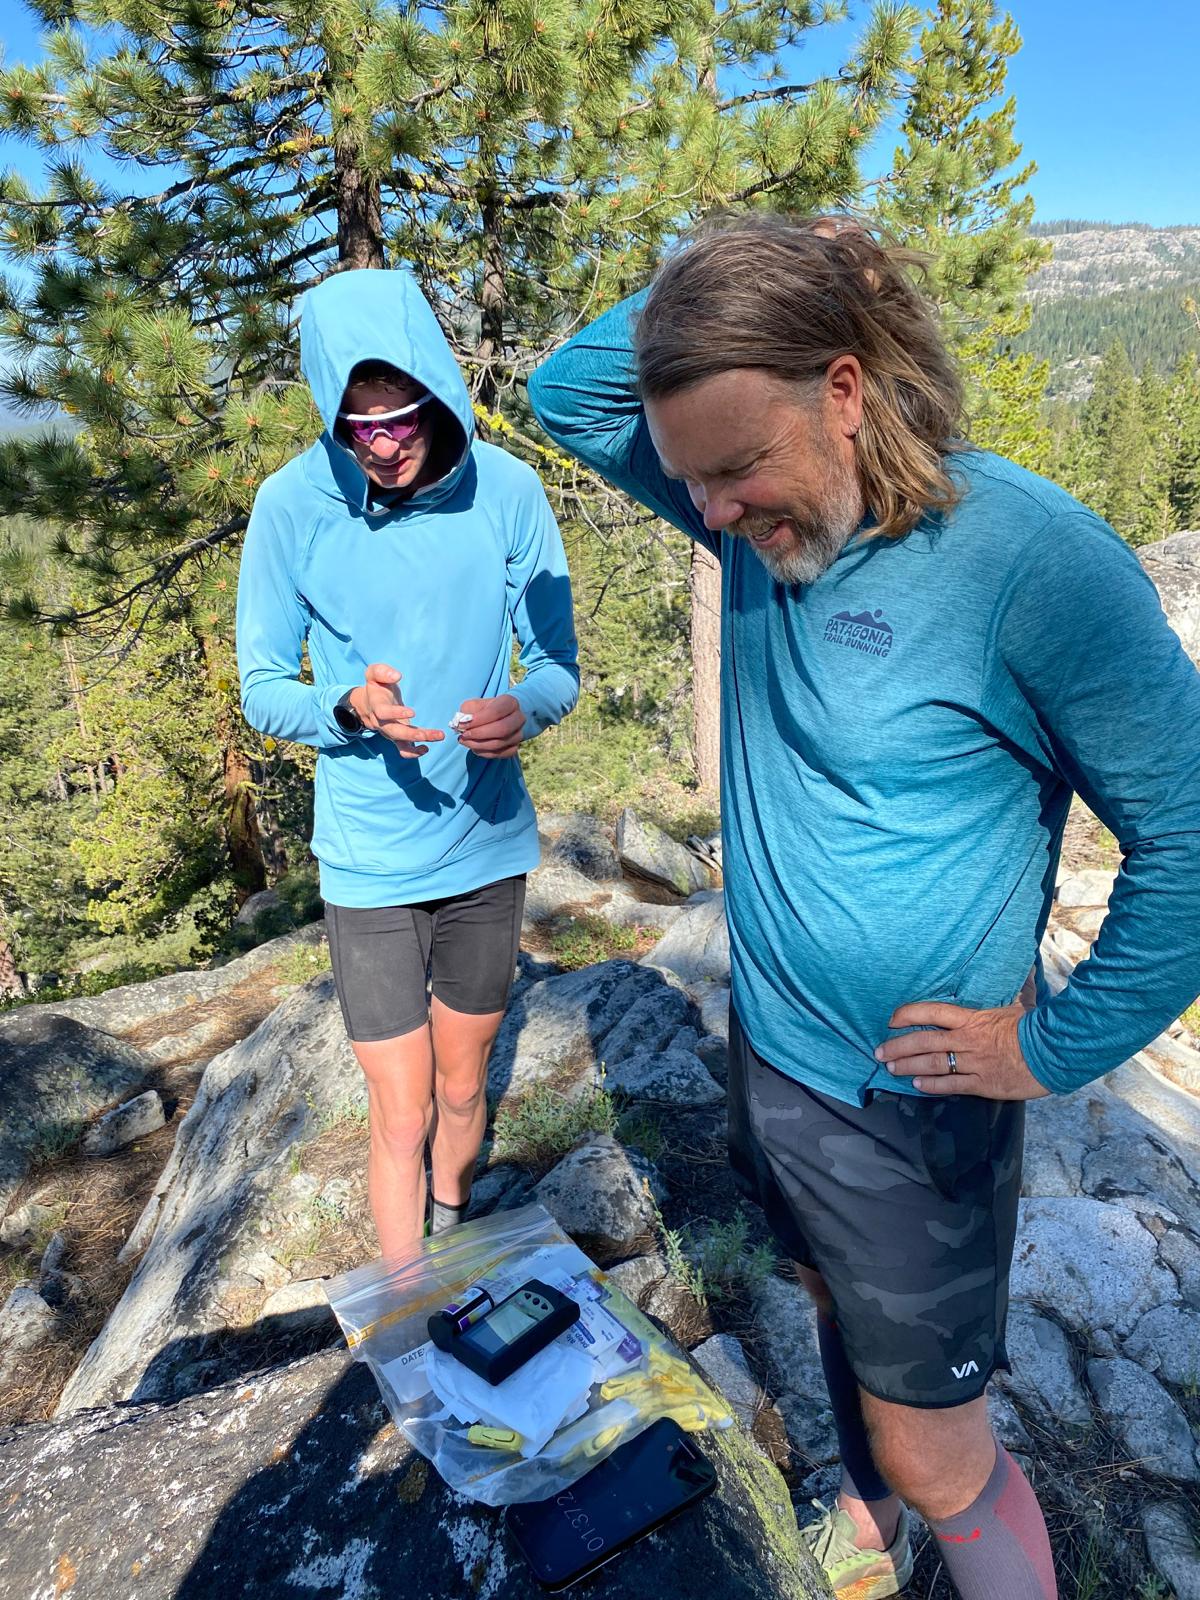
    Two men on a rocky outcrop among pines, one holding a fingertip for a blood sample beside a lactate meter set on a rock
    A lactate test in the middle of a hill-bounding session, with coach Will Sweetser and Quinn Holan. If you use lactate, spot-check often enough to learn your own daily variation. (Courtesy photo)

    My Advice

    • When analyzing what others say or publish, look closely and question what their training zones are based on. You must be speaking the same language before implementing any changes.
    • Pick a training zone model that makes sense to you. If you are going to use lactate, you must do frequent spot checks so you understand your individual daily variation. You absolutely cannot rely on a one-off test to make training decisions.
    • Use new and emerging technology, such as respiration and muscle oxygen monitoring, only after validating its consistency and variability.
    • Don’t jump from trend to trend. There are a lot of them out there. Learn from what has worked, and weigh emerging science against experience. Remaining current does not mean trend-hopping to stay relevant on social media.
    • Be clear on terminology. The same term can mean very different things to different scientists and coaches.
    • Use a couple of tests that produce meaningful data and inform training decisions. Collecting more data does not make for better programs.
    • For most people, perhaps everyone, percentage of maximal heart rate is a practical way to determine training zones.


    Help Support Our Coverage!

    If you value the thoughtful work and access FasterSkier provides, please consider becoming a Voluntary Subscriber. Your support directly fuels our work to cover the people, places, and moments that make our sport special.

    Join the FasterSkier community!
     

  • DIY Fitness Testing: The How and Why with Pepa Miloucheva

    DIY Fitness Testing: The How and Why with Pepa Miloucheva

    The SMST2 squad led by Jessie Diggins pushes the pace in a double pole interval workout during a fall 2019 training camp in Lake Placid, NY. (Photo: Matt Whitcomb / smseliteteam.wordpress.com)

    It’s May. Yes, really. 

    For most skiers, the new page on the calendar also marks the beginning of a new training year. Dust off your rollerskis, locate your heart rate strap and drink belt, and make sure your running shoes have plenty of life in them.

    With the country still predominantly on public health orders to stay close to home, avoid groups, and keep at least six feet of distance from those outside your home, kicking off a new cycle is happening without hugging our training partners, post-workout high fives, or otherwise gathering to ring in the new season. There also remains abundant uncertainty regarding the feasibility of racing during the upcoming season from the World Cup level to the junior and collegiate circuits to popular skiing. Nonetheless, we open our training logs and carry on. 

    Last season ended abruptly and the off season may have looked different than anticipated. We may have put our energy into homeschooling children, sourdough baking, binge-watching Tiger King, connecting virtually with our family and friends, or otherwise remaining largely homebound and less active than we’re accustomed. On the flip side, maybe the change in schedule has freed up additional time for long adventures and you’ve logged more hours in April than ever before. 

    Either way, at the onset of a season, you may be interested in checking in on your fitness and strength, looking for metrics to track improvement over time and to guide your pacing or heart rate zones during future workouts. FasterSkier reached out to Pepa Miloucheva, head coach of the Craftsbury Green Racing Project, to discuss fitness testing that could be done without the support of a facility or coach, making it accessible to any level skier as they begin the new year. 

    Miloucheva provided the disclaimer that she relies on advanced metabolic testing with her athletes to determine VO2 Max and lactate threshold levels to assess fitness and heart rate zones, and then prescribes training based on this information. With that caveat, Miloucheva holds a masters degree in Sport Science with a focus on physiology and biomechanics and has been coaching for over 20 years, over a dozen of which have been spent with the CGRP elite program. 

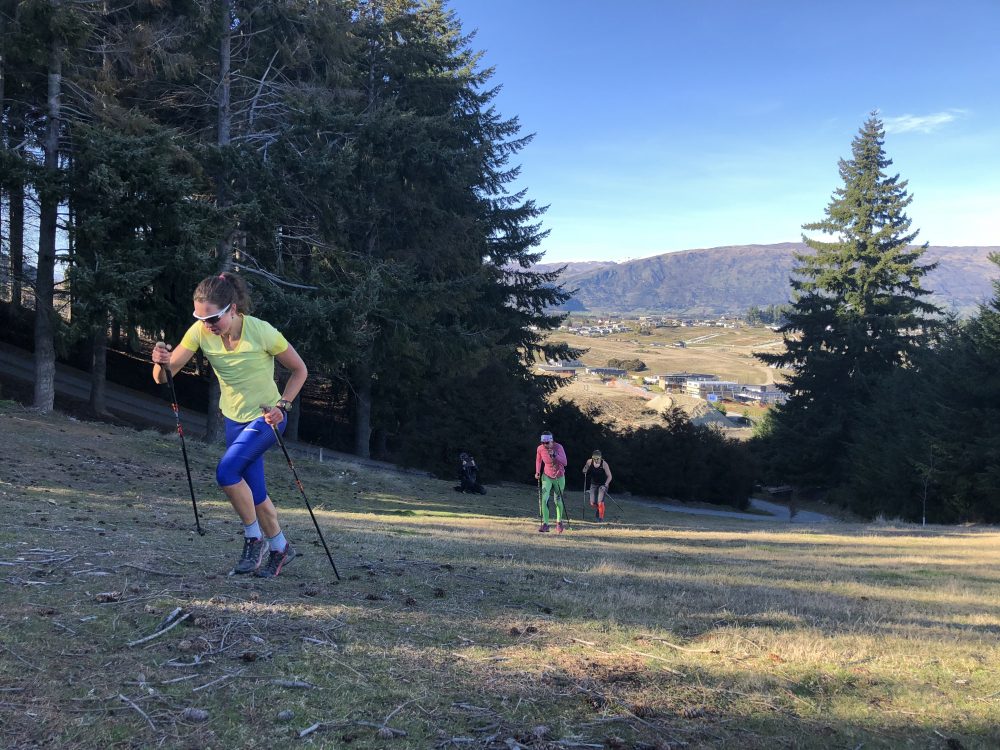
    Caitlin Patterson (far left) leads CGRP teammates running with poles. (Courtesy Photo)

    Before jumping into assessing fitness and blowing up trying to hit a new PR on the SkiErg, Miloucheva emphasized that the most important thing an athlete can do at the beginning of a new cycle is to have a training plan and to understand how the periodization targets different areas of athletic development. This might be a plan from a coach or one found online. 

    “If someone really wants to establish a baseline and monitor, then they have to have a training plan,” said Miloucheva in a call. “I think everything else is kind of pointless, because all of these tests won’t give you anything if you don’t know what you’re looking for. In general, everything starts with first having a good training plan.”

    Once a clear plan is established and you have taken time to understand it, then decide which part of the training process you would like to test. 

    “If you have 2-3 months of high volume, you want to test your basic aerobic improvement. You do the test, you see if you’ve actually improved. When you start doing a little bit more speed, you want to see if you’ve improved your speed. So you really have to schedule these tests based on your training plan.”

    As the typical periodization of the year for skiers focuses on aerobic development during the spring and summer, a good starting place could be an uphill run test, possibly combined with a rollerski or SkiErg time trial, if those are available to you.

    Traditionally, a 3000 meter run on the track was commonly used as an aerobic benchmark, but the results can be skewed based on individual running economy. Athletes with more running experience and better form often fare better than those with comparable or potentially better fitness. As such, most ski programs have transitioned toward an uphill run test, as it tends to level the playing field in terms of the impact of running efficiency on results.

    In addition to being a good indicator of aerobic capacity, Miloucheva explained that the test has the added benefit of being easily repeatable with relatively few outside variables that might impact performance.

    “The uphill running test is probably the most standard around the world. Simply, it’s easier to repeat. It’s a little bit less affected by the weather, but there are still a lot of elements and it is hard to keep it consistent.”

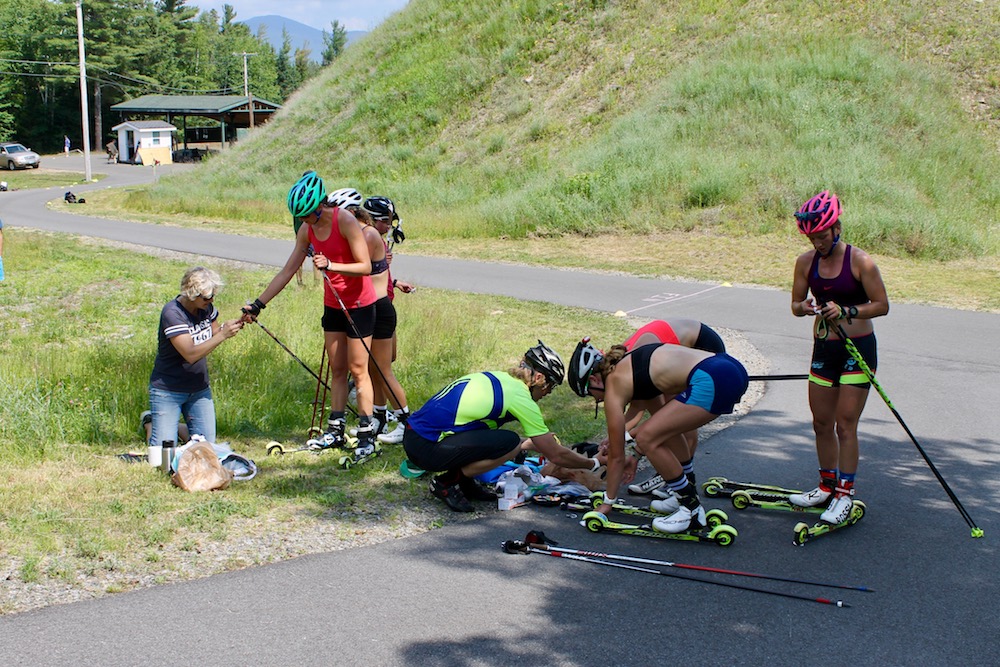
    Craftsbury Green Racing Project Head Coach Pepa Miloucheva (l) and Stratton Mountain School T2 Team Head Coach Pat O’Brien (center) assist athletes with lactate testing after the U.S. Ski Team’s rollerski team sprint on July 15, 2018 in Lake Placid, N.Y.

    If you’re looking to track your own progress on an uphill course, Miloucheva recommends finding a stretch of road or trail with little traffic that takes roughly 10-12 minutes. The effort should be steady throughout the test and you should finish feeling completely spent. 

    Be careful not to start out too fast as you want your heart rate to increase throughout the test, rapidly at first then gradually continuing to rise toward your lactate threshold heart rate, which can be estimated as the average heart rate sustained over the last five minutes of the test assuming it was well-paced. (TrainingPeaks has a deep dive on blood lactate and lactate threshold here, or you can read this description of lactate threshold training by Len Kravitz Ph.D., Exercise Science professor at the University of New Mexico.) 

    As for the course, you’re looking for terrain that is runnable, meaning you won’t need to resort to walking or hiking, and a relatively consistent grade. 

    Miloucheva later added that many veteran athletes have their own aerobic fitness test piece, which is also perfectly sufficient. 

    “I’m an old lady and I have this loop around the lake I do every year and I measure my time just for fun. So in general, everybody who has been training for years, they have a place where they can run the test.”

    Miloucheva has also used a 1-kilometer uphill double pole test on rollerskis with some of her athletes. Her course starts relatively flat, climbs gradually, then levels off at the finish. 

    “The biggest thing is that [athletes] need to keep moving, so it cannot be very steep because strength and the resistance become the issue [rather than fitness].”

    She has found this test harder to standardize than the run test, meaning results must be taken with a grain of salt. 

    “The problem using it year to year is that [the athletes] don’t always use the same rollerskis, they change wheels, cold weather and cold pavement changes a lot. So you have to consider all these details with the results.”

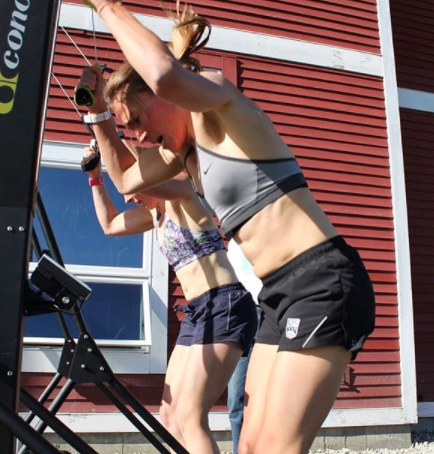
    Sophie Caldwell and Annie Hart square off for a SkiErg time trial during a week of testing with the SMST2 team in 2017. (Photo: Instagram @sophiecaldwell(

    Because of the ease of standardization, Miloucheva prefers using SkiErg time trials, as athletes can repeat the test indoors with a fixed resistance. Her junior athletes complete 1 and 2 k time trials, and her senior athletes additionally complete a 5 k test. The CGRP athletes complete the tests while hooked up to a VO2 Max testing equipment. If these are available to you, these tests could also serve as a benchmark for aerobic fitness with some ski specific strength indicators. 

    As for strength, Miloucheva is working on developing a test she feels is informative and can be standardized, as she is not satisfied with other tests used previously. She has historically used a version of the Canadian Strength Test (outlined here by Jackson Hole Ski & Snowboard Club), which counts the number of pull-ups, sit-ups, push-ups, box jumps, and dips an athlete can do in one minute with one minute rest between each exercise. Some differences in Miloucheva’s version include the use of single leg squats within a 30 second time period and measures pull-ups to exhaustion. 

    If you’re completing this test from home, ask a member of your household to help time, count, and keep your form honest so the data reflects your current strength accurately. 

    Okay, you’ve done an initial test of your aerobic fitness and/or strength. Now what? How soon should you repeat the test to check for improvement?

    Miloucheva reiterated that it is essential to plan testing between training blocks to assess whether the block had the intended impact on fitness. She explained that her testing weeks are written into her general yearly plan for athletes at the beginning of the season. 

    When considering your own plan, space the tests out roughly 6-10 weeks to give the body time to absorb and respond to training. In addition to striving for a faster time, you can also consider trends in heart rate, as more time during the test spent closer to the lactate threshold heart rate is also an indicator of improved aerobic capacity. 

    To get the most information from a testing period, it is essential that each round is approached the same way, including how the training looks in the days prior and the warm-up performed before beginning the tests. 

    “You want to have a standard approach into the test, because you don’t want to do the first test after a very exhausting week and the second after an easy week, because it will affect the results.”

    For CGRP athletes, this typically looks like one or two days of rest or easy training prior to a test. 

    There you have it. If you’re looking to assess and monitor progress in your fitness, first select and understand a training plan. Then, determine what factors of your fitness you’d like to assess and decide when a set of tests might fit best between different blocks within the training plan. Finally, do what you can to ensure that when the tests are repeated, the environment is as controlled as possible and your approach is the same so improvement (or lack thereof) between tests provides accurate insight into how your body is responding to training. 

    See you out there!  (from a safe social distance) 

  • CXC’s Center of Excellence Seeks to ‘Study Latest Innovations in the Sport’

    CXC’s Center of Excellence Seeks to ‘Study Latest Innovations in the Sport’

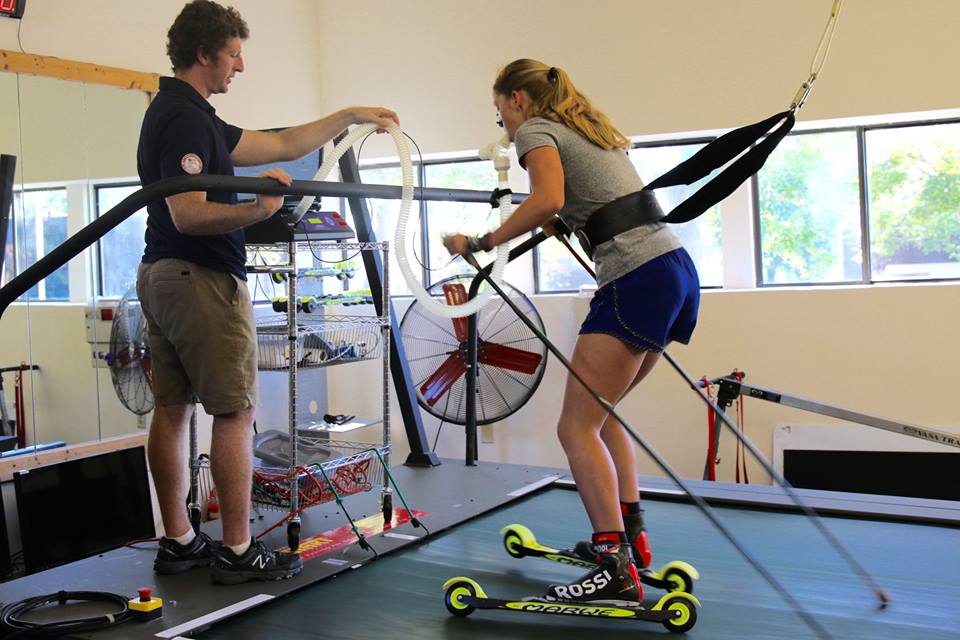
    Central Cross Country (CXC) Junior Development skier Siri Martin (r) gets a mid-summer VO2 max test on the rollerski treadmill at the Center of Excellence in Madison, Wisc. in late July (Photo: CXC Facebook)
    Central Cross Country (CXC) junior development skier Siri Martin (r) gets a mid-summer VO2max test on the rollerski treadmill at CXC’s Center of Excellence in Madison, Wis., in late July (Photo: CXC Facebook)

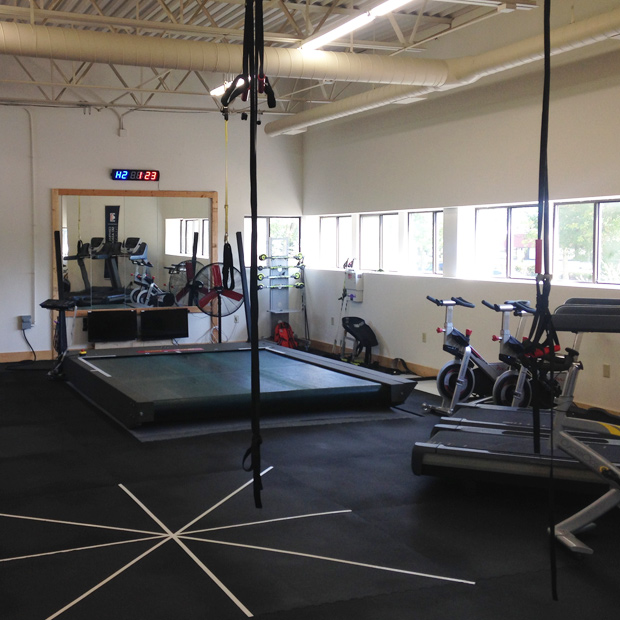
    A glance into any one of the glass windows lining the east side of Central Cross Country (CXC) Academy’s Center of Excellence building might give the impression of the average athlete gym. But if you step across the front threshold or take a peek at the academy’s 360-degree virtual online tour and sport science page, you’ll find much more than treadmills, stationary bikes and medicine balls.

    Located in Madison, Wis., the CXC Center of Excellence also houses a 10-by-12-foot rollerski treadmill, SkiErgs, and an in-house-made, power-pole machine. For many, though, equipment is not the most powerful tool in the center. Rather, it’s the center’s capacity to evaluate and educate its members and non-members alike about nordic skiing.

    Currently, the Center of Excellence offers performance evaluations, as well as fitness testing for lactate and VO2max using the oversized treadmill. Recorded and individualized technique coaching sessions on the rollerski treadmill are also available for those willing to pay $150 dollars per hour. To help athletes gain a better understanding of their body within sport, the center is also presently working on developing a biomechanical analysis software.

    A view of Central Cross Country's rollerski treadmill from the inside of the Center of Excellence (Photo: cxcacademy.com)
    The rollerski treadmill at the CXC Academy Center of Excellence (Photo: cxcacademy.com)

    And CXC recently hired a sport development and education director, Egor Akimov, CXC head coach Andy Keller explained on the phone.

    “He’s got a bachelor’s and PhD from the Russian State University in physical education and sport, so he majored in human physiology, he’s competed over in Russia and then he served on the Moscow Center of advanced sports technology as the head of the science department,” Keller said. “So he’s done a lot of research over in Russia on the biomechanics and stuff like that. He’s kind of leading our center [in Madison], doing a lot of the sessions down there and the technique work.”

    According to the CXC Executive and Athletic Director Yuriy Gusev, the Center of Excellence is approximately 90 percent complete. Anyone from CXC club members, to donors, to CXC team members, and the general public, can access the center at no cost. Rollerski treadmill evaluations cost CXC clubs $250 per day, $150 per hour for all others.

    “We are finalizing a few more partnerships on the sports science program and equipment but will start performing studies in cross country skiing this coming fall,” Gusev wrote in an email. “Our goal is to have top sports science facility to study latest innovations in the sport, potential application in cross country skiing to improve training, recovery and performance.”

    While the CXC elite team, known as the CXC Team, uses the center for testing, its current base in Marquette, Mich. has also led the team to seek out other partnerships. This included collaborating with the Northern Michigan University (NMU) Olympic Training Site, allowing CXC Team members to use the school’s facility and other amenities.

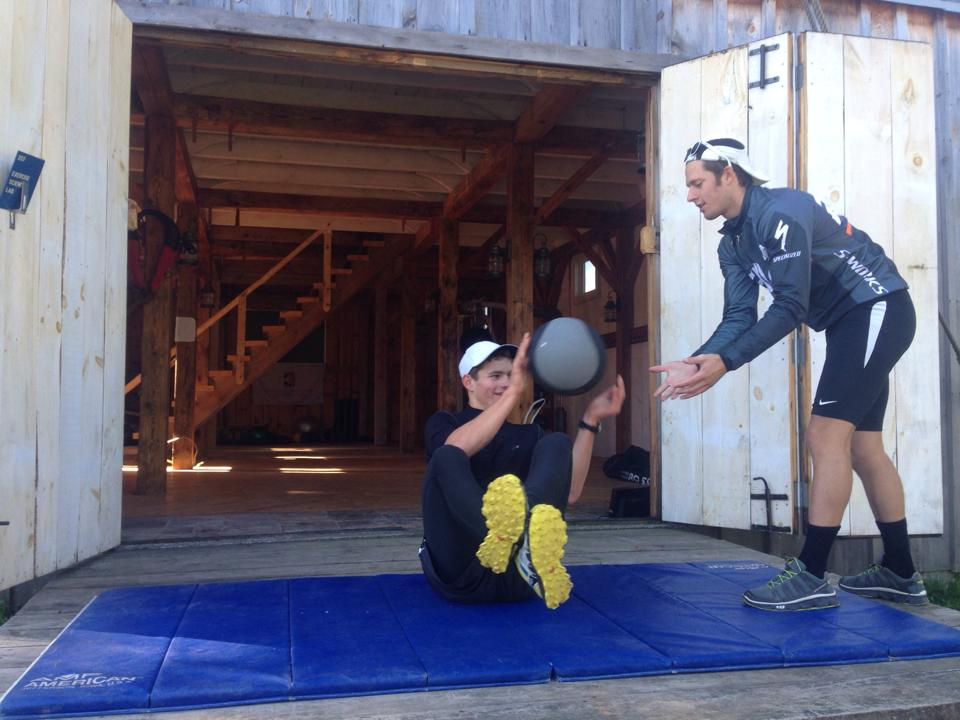
    The newly appointed CXC Team Head Coach Andy Keller (r) works on strength with an athlete outside a barn near Cable, Wis. (Photo: CXC/Facebook)
    CXC Team Head Coach Andy Keller (r) works on strength with Scott Harrison outside a barn near the team’s former home base in Cable, Wis., in 2014. The team is now based in Marquette, Mich. (Photo: CXC/Facebook)

    “This year we moved up to Marquette partly because a lot of the athletes have come from Northern Michigan, but also because there’s quite a bit of opportunity up here,” Keller said. “We’ve kind of partnered up with the Olympic training site located here. So we’ve been able to use the dorms on campus, offer schooling, have a training room and weight facilities available. … [The move to Marquette] has given us a lot more freedom with athlete housing and training opportunities.”

    At present, the CXC Team has three full-time athletes and two part-time collegiate skiers. Kyle Bratrud returned to the CXC elite team for his second year; new full-time members include Dartmouth graduate Oscar Friedman and NMU grad Felicia Gesior. Jan Ketterson, a Dartmouth student currently taking the fall and winter trimesters off to focus on skiing, plans to race for CXC along with Nicole Bathe, presently a student at University of Alaska Fairbanks.

    The growing numbers on the CXC Team was one reason CXC also recently decided to nix its marathon team, Keller explained.

    “That was kind of another thing with refocusing with the marathon team, just my role and what resources I can put out just being by myself,” Keller said. “The main reason why we [ended our marathon team] is we’re trying to make a big push to promote club development.”

    By discontinuing the marathon team, CXC saw an opportunity for athletes to return to their home clubs and promote racing on a more local, community-based level.

    “The athletes that were on our team last year, both our current athletes and our previous athletes that we don’t have on the team anymore, we encouraged them this upcoming year to be a part of the clubs in their local area,” Keller said. “From what I heard in talking to them, most will continue to race in some facet.”

    Chris Pappathopoulos won the men's overall Central Cross Country Marathon Cup last season while competing for the CXC marathon team. (Photo: CXC)
    Chris Pappathopoulos won the men’s overall CXC Marathon Cup last season while competing for the CXC marathon team. (Photo: CXC)

    He added that the team’s reigning CXC Marathon Cup winner Chris Pappathopoulos would likely be supported by companies like Rossignol and Boulder Nordic Sport.

    While former CXC marathon team members like Pappathopoulos will look to return to their local clubs, Keller looks to expand the CXC Team program and podium at U.S. nationals with the athletes he’s currently working with.

    “For a couple years [CXC] was really down and out from the years when we had Jessie [Diggins], Caitlin [Gregg], and Jennie [Bender], all those strong athletes,” he said. “So we definitely want to get back to fighting for SuperTour podiums, fighting for World Cup spots … and in this next year, I think there’s athletes who are on our team that are capable of it.”

    With access to the NMU Olympic Training Site, CXC’s Center of Excellence and new scientific research taking place this fall,  Keller doesn’t doubt CXC as a force to be reckoned with this season and seasons to come.

    “We have the training group, we have the structure and the facilities,” Keller said. “And I think the more excitement we got here, the more we can achieve those goals of being at the top level.”

  • Testing, One Two Three

    Testing, One Two Three

    lactate, heart rate testing
    USST coaches administering lactate tests during a sprint workout in Lake Placid, N.Y., in September 2011. At the team’s recent training camp in Park City, Utah, athletes underwent physiological testing in a more controlled environment in the lab at the Center of Excellence.

    The U.S. Ski Team’s cross-country athletes finished their final round of pre-season testing last week in Park City, Utah. Athlete blogs currently abound with documentation of skiers pushing themselves to the point of falling off the treadmill in order to collect data on how much they’ve each progressed since their last test. The importance an athlete attaches to his or her test results varies by individual, but in the lab and in training they can help measure fitness and individual year-to-year progress.

    For an endurance sport in which performances are measured against a clock, nordic skiing gives its participants relatively few opportunities to measure absolute progress. You can run a personal record on the track know that you’ve never had a better race in your life, but on skis the only improvement marker athletes have to go by is whether they beat people they’ve never beaten before. Skiers of all ages frequently express frustration with the fact that the most concrete feedback available as to whether their training is working depends both on how they ski but also on how everyone else skis on any given day.

    Perhaps this is why nordic enthusiasts are so fascinated with physiological testing data of others. Even though they are no substitute for actual results, people still keep track of things like VO2 max records. There’s a reason they don’t hand out medals for setting one, however. Test results say as much about your next race as Peyton Manning’s season passing yards says about whether the Broncos will win on Sunday. They indicate part of how good an athlete you are, but can’t predict the outcome of an actual contest.

    This fact, combined with the finicky nature of collecting accurate data in the lab, causes some athletes to place more importance on test results than others. Andy Newell, for example, just completed some of the best treadmill tests of his career last week. The USST has a policy of not disclosing exact data, but speaking qualitatively the American sprinter said his results were highly encouraging.

    “I use this data as a sign that the training year has gone to plan and that I’ve done a good job of absorbing the hard training I’ve done in the last few weeks,” Newell said. “It’s always encouraging to have good tests because it confirms that we are getting fitter and stronger and definitely gets me stoked to get the skis on and start racing.”

    In his second testing season with the USST, Erik Bjornsen also turned in improved test results.

    “My goal this year was to improve my motor and to improve my skating technique. I feel I accomplished both,” Bjornsen wrote in an email. “My goal for the next couple months is to improve power and strength.”

    Others athletes and teams don’t set a great deal of store by test results; Canadian National Ski Team head coach Justin Wadsworth doesn’t have any of his men undergo treadmill testing because he thinks he can gauge progress well enough with intervals and time trials.

    “Testing, for me, you really need to garner something out of it and to make it worthwhile,” he said last week. “I think a lot of people test just for the sake of testing and I think for our women, we have been trying some new training methods with them and we do want to see what changes are happening, but with the guys [the training] is pretty stable.”

    For different reasons, Noah Hoffman took only hemoglobin mass and body composition tests last week and opted out of treadmill and strength testing in Park City. He, too, doesn’t think the data tells him anything he doesn’t already know, but his current training priorities also lie elsewhere at the moment.

    “I have chosen not to test because I have never seen results from a testing session that have helped me become a better skier,” Hoffman wrote in an email. “Testing for me, right now, belongs in the same category as altitude manipulation, diet, stretching, specific psychology work, and strength training. They are all important but they do not come close to representing the bulk of my limitations as a ski racer.”

    Those limitations, he says, lie mainly in technique, and that’s where Hoffman has decided to spend his most of his time and energy at the moment.

    “Technique and energy add up to minutes in a 15 kilometer race. All of the other factors add up to seconds. I hope to reach a point in my career where every factor combines to mean the difference between gold and silver in the Olympics, but right now I’m focusing on the areas that represent the biggest available gains,” he said.

    A few other USST athletes didn’t undergo testing for circumstantial reasons last week, such as illness and injury. For those who did participate in testing at the Center of Excellence, data was collected from five major testing categories:

    1. Body composition and functional movement. This included body fat composition, mobility and flexibility tests. From results, athletes can measure where they are putting muscle mass on and can identify where they might be prone to injury. Body fat tests are helpful to Newell, for one, because “it can be easy to get too thin during some of the hard months of training,” he said. “I try to keep a little bit more body fat during the summer and fall because I think it helps me absorb the training better and helps be build more power. So by using tests like this I can make sure my body is holding up to the training.”
    2. Strength testing to measure overall power. The team uses force plates to determine whether athletes are building strength and are able to use it quickly in dynamic movements like squat jumps. “We are measuring very small differences but a lot of these tests are good at making sure we are converting out gym workouts into explosive power that can be used on the snow and especially in sprinting,” Newell said.
    3. Double-pole treadmill test. Athletes measure how long they can hang onto the treadmill and the percentage of their max they can ski at while only double-poling. “If an athlete is only double-poling at 60-70 % of their max it’s a good sign that they need to work on double-poling,” Newell said. “Really good double-polers…can hammer along at a very high heart rate,” at around 90-97 % of their VO2 max. The treadmill is set to a constant speed of about 10 mph for this test, and the grade is increased each minute until the athlete falls of the back. “For me this test takes 14 to 15 minutes so it’s a really hard effort,” Newell said. “I usually get very close to my VO2 max while double-poling and the other day put up a lactic acid reading of 15.4 mmol/L.”
    4. The VO2 max test. There are many ways to do this one (running, cycling or skiing), and the USST measures it with classic striding. While gathering data on aerobic capacity, the USST also collects lactate profile, heart rate and lung capacity data. As in the double-pole test, the treadmill is set to a constant speed while the grade increases every minute.
    5. Total hemoglobin mass. During an altitude training block like the national team just underwent in Park City, athletes take a hemoglobin test at the beginning, middle and end of the camp to track the change in total hemoglobin mass, which will change as the athlete adjusts to the thinner air.

    Apart from providing feedback on training progress, the USST staff use the results of their athletes’ hemoglobin mass and VO2 max tests to determine when athletes should start living at altitude prior to major high-elevation races like World Championships (Val di Fiemme is just under 4,000 feet) and the Olympics (Sochi’s cross-country and biathlon complex will be around 5,000 feet).

    “If we’re looking to enter a championship with the most powerful blood you can arrive with, we need to know how long it takes an athlete to acclimate appropriately, how high they need to be,” said USST women’s coach Matt Whitcomb.

    The national team has several locations in Europe of varying altitudes that it uses for pre-competition acclimation. “As we head into World Championships, we have some athletes who will live in Davos, Switzerland, to get a little bump before heading to [Val di Fiemme]. Others who don’t respond well to living at altitude will spend time lower in Ramsau, Austria, or Predazzo, Italy, beforehand to have a post-Sochi [World Cup] speed camp instead,” Whitcomb said.

    Similarly, altitude acclimation data will help inform preparation for the main event, the 2014 Sochi Olympics. Newell has learned that his body has the same response to living at 5,000 feet as it does to living at 7,000 feet, and this information will help determine where he’ll live leading up to the Games.

    The Americans finished the Park City segment of their camp this week; athletes are headed to Canmore on Thursday for a final on-snow segment. The ultimate test of fitness is still the time-trial, and the USST has distance and sprint races scheduled for Frozen Thunder next week.