This article was submitted by a reader. To pitch a story or article to FasterSkier, reach out to info@fasterskier.com.
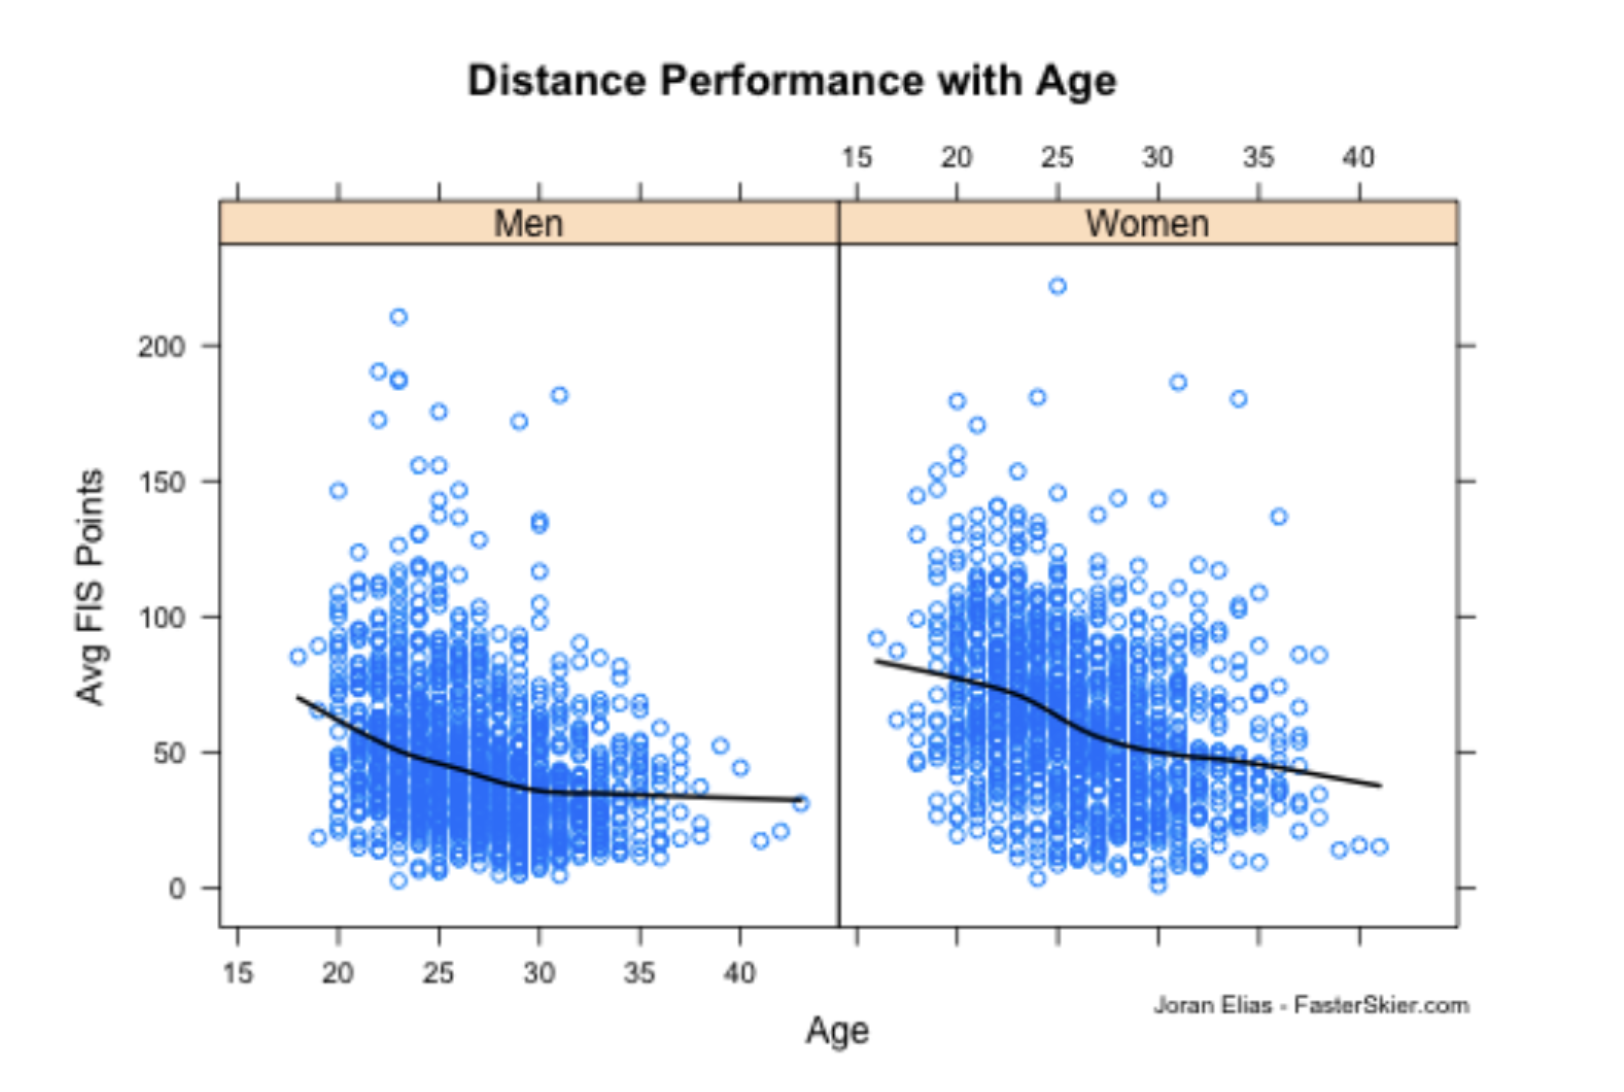
In 2010, FasterSkier published an article titled “Analysis: Performance and Age”, written by Joran Elias, or as he is otherwise known, “The Statistical Skier.” The piece attempted to parse the relationship between age and performance by comparing the ages of some of the world’s top skiers to their FIS points in a given year. Elias was quick to acknowledge the limitations of the analysis, primarily that the data appeared to exhibit selection bias. The oldest skiers on the World Cup, still racing well into their 30s, were likely still racing precisely because they were the best of the best, while those who were not performing as well retired sooner, and weren’t reflected in the data. These data appeared to show a trend of improvement associated with getting older, but to what degree was this apparent trend a result of the selection bias?
In the now hallowed annals of the FasterSkier comments section, a commenter with a name none other than Dakota Blackhorse-von Jess, a veritable force in U.S. skiing for over a decade, posed a potential solution. He asked, “Can you filter the dataset so that only athletes that are still competing at some reasonable later stage (say 30 or 32) are represented?”
It was a great question. What would happen if we were able to look at careers that spanned a longer period of time and plotted the trajectories of those careers as the athletes aged? This would mitigate the effects of attrition on the data and hopefully give us a clearer picture.
The question of what happens to the performance of cross country skiers as they age has personal significance to the authors of this article. Both of us are solidly into our 20s and deeply invested in the project of being competitive at the highest levels of ski racing. At the University of Wyoming, we are both involved in furthering the development of a growing program which serves college graduates, many of whom are pursuing graduate studies alongside elite ski racing.
Athletes at this age often have the unenviable experience of watching as some members of their age cohort find success on the world stage while others do not. It leaves us to wonder what is possible and what is likely for us to achieve as we move from teens to twenty-somethings to thirty-somethings.
The recent success of Rosie Brennan on the World Cup and at the Olympics has contributed to reigniting a decades old conversation about age, skier development, and team selection. One has to imagine that this “conversation,” at times less than cordial (as evidenced by archived comment threads on this website), has ended friendships, and who knows, maybe even a few marriages. Brennan, who has seen striking improvement in her 30s, skied in college despite the U.S. Ski Team’s erstwhile insistence that promising young skiers should “strike while the iron is hot,” eschewing school and taking on international ski careers full time. After Brennan’s 4th place in the 30km at the Beijing Olympics, U.S. Ski Team Head Coach Matt Whitcomb acknowledged that the previous development strategy may have been short sighted. At this point, many of America’s most standout skiers have chosen to ski in college, adding renewed urgency to the question of age and development. At the risk of adding fodder to an already crowded debate, let’s get into the data.
***
In hopes of combatting the potential selection bias of slower skiers retiring earlier, we focused on skiers that stayed in the game for at least 20 years, or at least held a FIS license and skied in 5+ FIS races per year for that long. To put that in perspective, the FIS points system has only been around since 1994, or 28 total seasons. As you can see in the figure below, the vast majority of skiers who ever hold a FIS license only hold one for a few years. Those that continue to ski seriously enough to buy a FIS license for 20 years are a tiny, tiny fraction of the skiers. On average, these “20-season skiers” get their first FIS license around the age of 19 and continue past 40. Additionally, every member of this group happens to fall loosely into the category of “professional skier,” having received at least one World Cup, World Championship, or Olympic start at some point in their career.
 We used FIS distance points from the last period of each season from 1994 to 2022. While it would have been interesting to track sprint points as well, the more recent arrival of sprinting makes a long term analysis less feasible. In the graph below, each black line represents the career trajectory of a “20-season skier.” There are 40 athletes represented, 23 of whom are men and 17 of whom are women. Interestingly, the ratio of men to women who hold FIS licenses for at least 20 years is more or less consistent with the ratio of men to women who have ever held one, suggesting that one gender does not have significantly more “staying power” than another in the highest levels of the sport. The blue lines represent the overall trend.
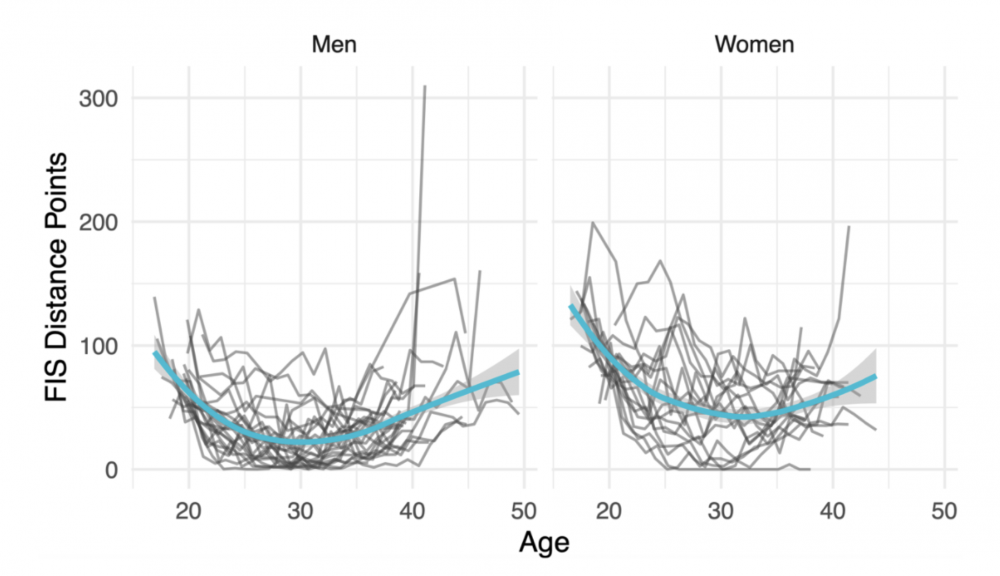
Whereas Elias’ 2010 analysis shows a continuing downward points trend even as skiers reach their 40s, ours shows more of a u-shaped trend. Skiers improve in their teens and 20s, reaching a peak around 30, then begin to experience an increase in points in their late 30s and 40s. This seems to suggest that athletes improve until they hit some peak age and then stop performing as well when they get older.
We can, in fact, fit a trendline and calculate that peak age at which the average skier (or at least the average skier who skied seriously for 20+ years) hits their lowest points. That magic age based on these data happens to be 31.5 for men and 32.0 for women. However, the striking story shown by the mess of black lines is that no one is “the average.” There are clearly many other factors at play in determining a skier’s performance. Some athletes have their worst seasons in their late 20s while others have stellar seasons in their late 30s and even early 40s. At nearly 41 years old, Italian Giorgio Di Centa stood at 2.9 FIS points, notching multiple top tens on the World Cup. At 38, Marit Bjørgen stood at 0.9, never leaving the podium at the PyeongChang Olympics in 2018. There is valuable information to be gleaned from both the aggregate and the individual.
These results were surprising given the disparity between the 2010 analysis and our own. Why did Elias find a continuing downward trend where we found an upward slope after 30? Was it possible that his results were driven strongly by attrition and selection bias as he suggested? We went back to the data, this time including everyone with a FIS license, regardless of how many years they held one. We saw the same u-shaped trend as before. Skiers continued to improve until their late 20s to early 30s before an upward slope in points as they reached their 40s. This was not just the case for elite world cup skiers, but more casual racers as well. A similar trend is present whether exclusively analyzing skiers with points under 50 or over 500. Additionally, the age of peak performance stays in the range of 29-32 regardless of the chosen points tier.
Instead of analyzing within point tiers, what if we returned to our “20-season skiers” and segmented each athlete’s career into two pieces–one before their last World Cup, World Champs, or Olympic race–and one after? This way we would be able to see the difference in performance between skiers at the height of their professional careers in comparison to the years that followed.

The results of this breakdown make sense intuitively. When we separate the careers into “World Cup” and “post-World Cup” segments, the upward trend coincides with retirement and is much steeper for those athletes who have stepped away from World Cup racing. People don’t ski as fast after their last season on the World Cup as they did before. One possible explanation for this is that many athletes retire from the highest levels of international competition, stop training as seriously, and begin to perform worse as a result. Another explanation is that athletes continue to ski on the World Cup until their performance stops improving, and then retire (or are forced to retire) as a result.
While our results alone can’t distinguish between these possibilities, it seems likely that some combination of them are responsible. Regardless, we believe including serious post-World Cup racing in our analysis allows us to gain valuable insight into the effects of age on performance and supports our conclusion of a peak age around 32. It is also important to reiterate that there are athletes for whom the trend is not representative in the first place. Nothing about our analysis suggests the inevitability of career decline by the age of 32.
These results do seem to partially explain the discrepancy between our analysis and Elias’, but isolating the World Cup portion of their careers does not fully eliminate the trend of skiers eventually slowing down. The graph is still “u-shaped.” It appears that a reason for this is that the landscape of professional skiing has changed since the initial 2010 analysis. Additional comparison of data before and after 2010 indicates that the phenomenon of points swinging upward with age is a relatively recent one, in part the result of a growing number of skiers continuing to race very seriously at older ages. In other words, the effects of attrition have become less prominent since 2010 because there is simply less attrition.
Perhaps the more interesting question here is, what circumstances and structures have allowed this subset of skiers to race at such a high level for so long, while the majority of elite skiers have far, far shorter careers? It may be worth asking how many people are forced to quit before their potential has been reached because they lack opportunities and support. Prior to 2010, individuals over the age of 40 only made up 0.4% of total FIS license holders. In the period since then, that proportion has more than doubled and there are over five times the total number of license holders over 40. Athletes who are deemed too old to present the shimmering possibility of medals and crystal globes may not be getting as many resources, but they are showing up to train and race in increasingly high numbers anyway. There are, after all, reasons to race besides winning medals.
Ella DeWolf graduated from the University of Wyoming with her BS in molecular and microbiology and MS in botany. She continues to coach and race while working as a data analyst for an environmental consulting firm.
Andrew Siegel graduated from the University of Vermont in 2021 and is now at the University of Wyoming–coaching, racing, and pursuing an MFA in creative writing.
This research was made possible by the generous support of the non-profit SNOW (Skiers Nordic of Wyoming).