From the FasterSkier archive — posts syndicated from athletes’ and coaches’ own blogs between 2004 and 2012, kept online as published. Current coverage is at fasterskier.com.

Tag: Statistics

  • Trends in Age and Ski Performance: A Second Look by Ella DeWolf and Andrew Siegel

    Trends in Age and Ski Performance: A Second Look by Ella DeWolf and Andrew Siegel

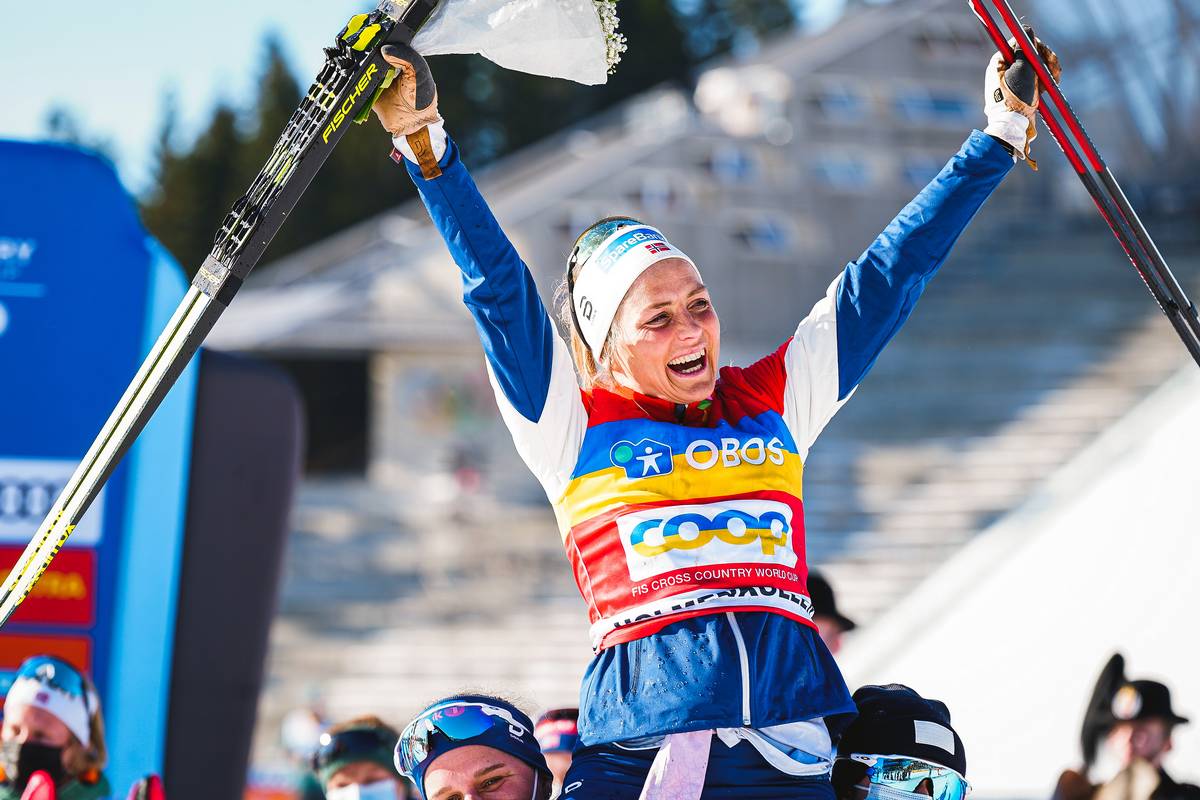
    Norway’s Therese Johaug celebrates her final 30 k race at Holmenkollen, before retiring at the end of the 2021/22 season at age 33. (Photo: NordicFocus)

    This article was submitted by a reader. To pitch a story or article to FasterSkier, reach out to info@fasterskier.com.

    In 2010, FasterSkier published an article titled “Analysis: Performance and Age”, written by Joran Elias, or as he is otherwise known, “The Statistical Skier.”  The piece attempted to parse the relationship between age and performance by comparing the ages of some of the world’s top skiers to their FIS points in a given year.  Elias was quick to acknowledge the limitations of the analysis, primarily that the data appeared to exhibit selection bias.  The oldest skiers on the World Cup, still racing well into their 30s, were likely still racing precisely because they were the best of the best, while those who were not performing as well retired sooner, and weren’t reflected in the data.  These data appeared to show a trend of improvement associated with getting older, but to what degree was this apparent trend a result of the selection bias?
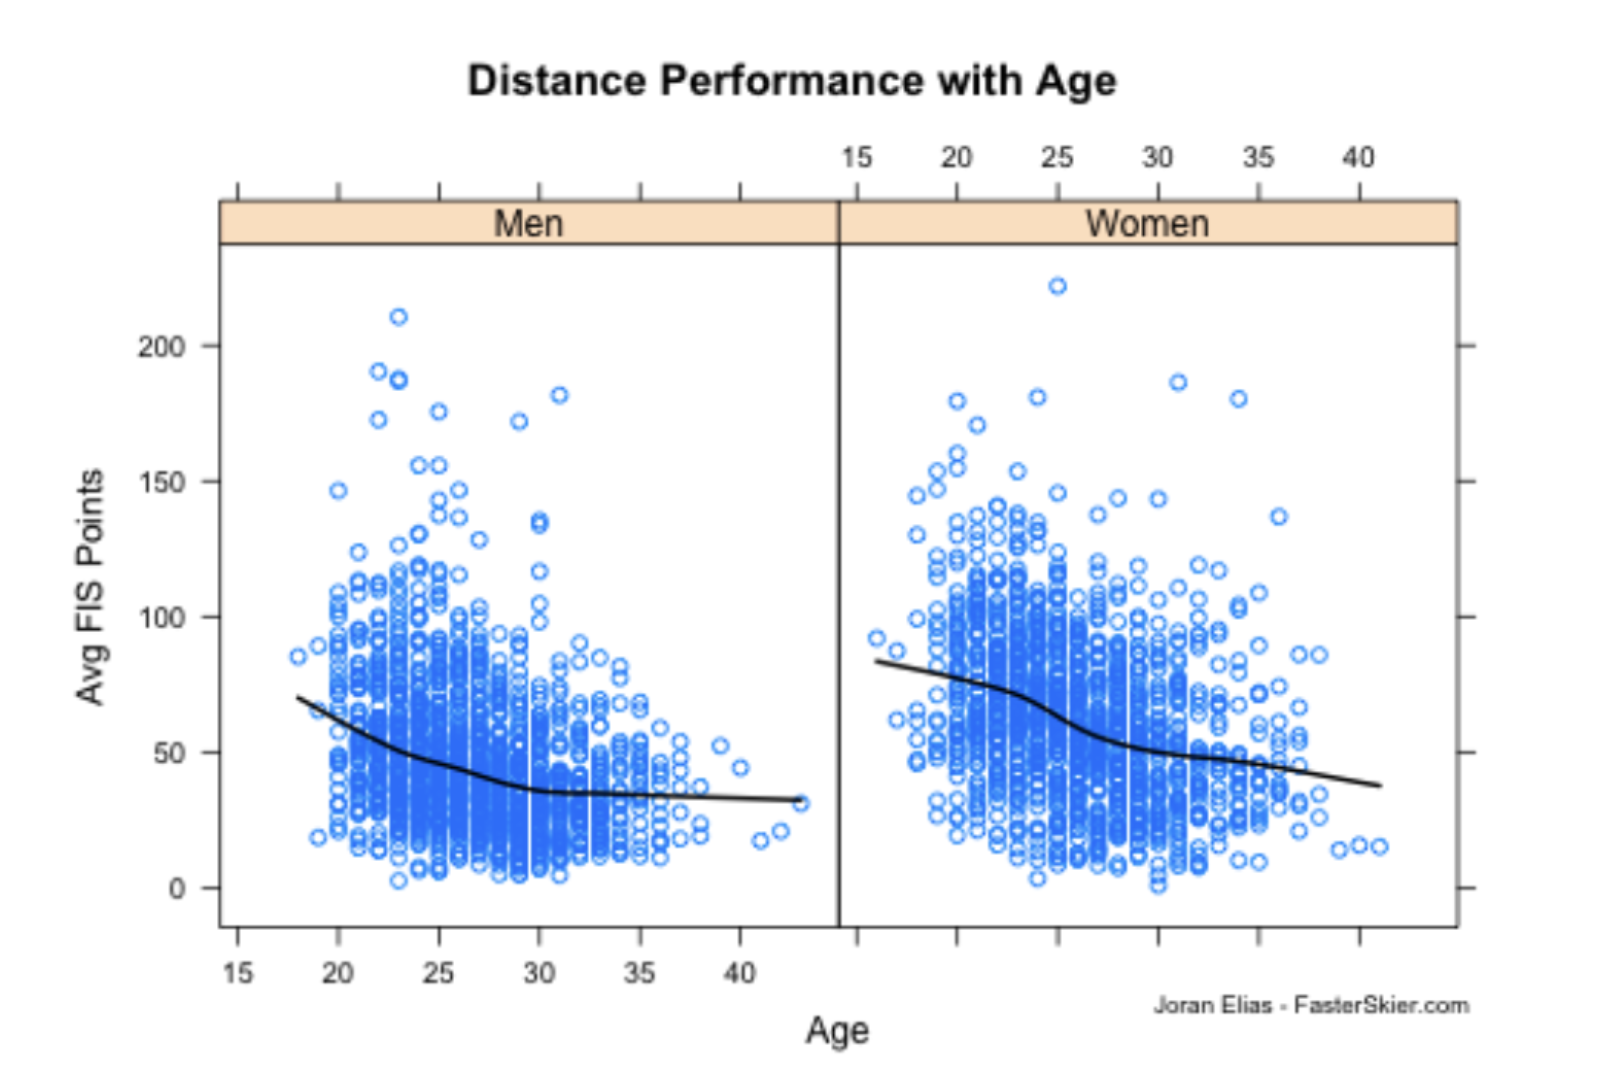
    Elias’ original figure showing distance performance by age, published on FasterSkier in March, 2010.

    In the now hallowed annals of the FasterSkier comments section, a commenter with a name none other than Dakota Blackhorse-von Jess, a veritable force in U.S. skiing for over a decade, posed a potential solution.  He asked, “Can you filter the dataset so that only athletes that are still competing at some reasonable later stage (say 30 or 32) are represented?” 

    It was a great question.  What would happen if we were able to look at careers that spanned a longer period of time and plotted the trajectories of those careers as the athletes aged?  This would mitigate the effects of attrition on the data and hopefully give us a clearer picture.

    The question of what happens to the performance of cross country skiers as they age has personal significance to the authors of this article.  Both of us are solidly into our 20s and deeply invested in the project of being competitive at the highest levels of ski racing.  At the University of Wyoming, we are both involved in furthering the development of a growing program which serves college graduates, many of whom are pursuing graduate studies alongside elite ski racing. 

    Athletes at this age often have the unenviable experience of watching as some members of their age cohort find success on the world stage while others do not.  It leaves us to wonder what is possible and what is likely for us to achieve as we move from teens to twenty-somethings to thirty-somethings.

    The recent success of Rosie Brennan on the World Cup and at the Olympics has contributed to reigniting a decades old conversation about age, skier development, and team selection.  One has to imagine that this “conversation,” at times less than cordial (as evidenced by archived comment threads on this website), has ended friendships, and who knows, maybe even a few marriages.  Brennan, who has seen striking improvement in her 30s, skied in college despite the U.S. Ski Team’s erstwhile insistence that promising young skiers should “strike while the iron is hot,” eschewing school and taking on international ski careers full time.  After Brennan’s 4th place in the 30km at the Beijing Olympics, U.S. Ski Team Head Coach Matt Whitcomb acknowledged that the previous development strategy may have been short sighted.  At this point, many of America’s most standout skiers have chosen to ski in college, adding renewed urgency to the question of age and development.  At the risk of adding fodder to an already crowded debate, let’s get into the data. 

    ***

    In hopes of combatting the potential selection bias of slower skiers retiring earlier, we focused on skiers that stayed in the game for at least 20 years, or at least held a FIS license and skied in 5+ FIS races per year for that long. To put that in perspective, the FIS points system has only been around since 1994, or 28 total seasons. As you can see in the figure below, the vast majority of skiers who ever hold a FIS license only hold one for a few years.  Those that continue to ski seriously enough to buy a FIS license for 20 years are a tiny, tiny fraction of the skiers. On average, these “20-season skiers” get their first FIS license around the age of 19 and continue past 40.  Additionally, every member of this group happens to fall loosely into the category of “professional skier,” having received at least one World Cup, World Championship, or Olympic start at some point in their career.

    We used FIS distance points from the last period of each season from 1994 to 2022.  While it would have been interesting to track sprint points as well, the more recent arrival of sprinting makes a long term analysis less feasible.  In the graph below, each black line represents the career trajectory of a “20-season skier.”  There are 40 athletes represented, 23 of whom are men and 17 of whom are women.  Interestingly, the ratio of men to women who hold FIS licenses for at least 20 years is more or less consistent with the ratio of men to women who have ever held one, suggesting that one gender does not have significantly more “staying power” than another in the highest levels of the sport.  The blue lines represent the overall trend.
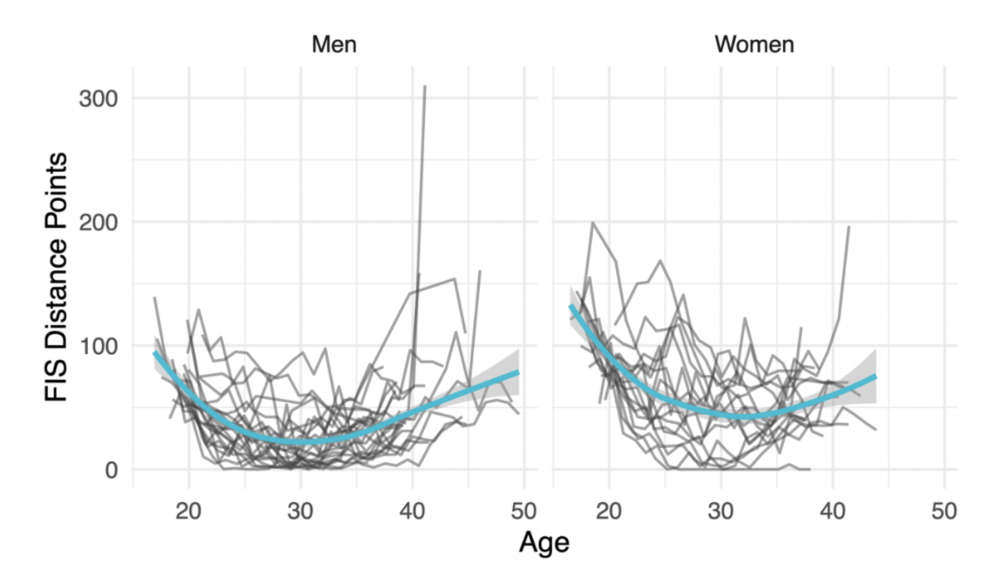
    Whereas Elias’ 2010 analysis shows a continuing downward points trend even as skiers reach their 40s, ours shows more of a u-shaped trend.  Skiers improve in their teens and 20s, reaching a peak around 30, then begin to experience an increase in points in their late 30s and 40s. This seems to suggest that athletes improve until they hit some peak age and then stop performing as well when they get older.

    We can, in fact, fit a trendline and calculate that peak age at which the average skier (or at least the average skier who skied seriously for 20+ years) hits their lowest points. That magic age based on these data happens to be 31.5 for men and 32.0 for women. However, the striking story shown by the mess of black lines is that no one is “the average.” There are clearly many other factors at play in determining a skier’s performance. Some athletes have their worst seasons in their late 20s while others have stellar seasons in their late 30s and even early 40s.  At nearly 41 years old, Italian Giorgio Di Centa stood at 2.9 FIS points, notching multiple top tens on the World Cup.  At 38, Marit Bjørgen stood at 0.9, never leaving the podium at the PyeongChang Olympics in 2018.  There is valuable information to be gleaned from both the aggregate and the individual. 

    These results were surprising given the disparity between the 2010 analysis and our own. Why did Elias find a continuing downward trend where we found an upward slope after 30? Was it possible that his results were driven strongly by attrition and selection bias as he suggested?  We went back to the data, this time including everyone with a FIS license, regardless of how many years they held one. We saw the same u-shaped trend as before.  Skiers continued to improve until their late 20s to early 30s before an upward slope in points as they reached their 40s. This was not just the case for elite world cup skiers, but more casual racers as well.  A similar trend is present whether exclusively analyzing skiers with points under 50 or over 500.  Additionally, the age of peak performance stays in the range of 29-32 regardless of the chosen points tier.

    Instead of analyzing within point tiers, what if we returned to our “20-season skiers” and segmented each athlete’s career into two pieces–one before their last World Cup, World Champs, or Olympic race–and one after?  This way we would be able to see the difference in performance between skiers at the height of their professional careers in comparison to the years that followed.

    The results of this breakdown make sense intuitively. When we separate the careers into “World Cup” and “post-World Cup” segments, the upward trend coincides with retirement and is much steeper for those athletes who have stepped away from World Cup racing.  People don’t ski as fast after their last season on the World Cup as they did before.  One possible explanation for this is that many athletes retire from the highest levels of international competition, stop training as seriously, and begin to perform worse as a result.  Another explanation is that athletes continue to ski on the World Cup until their performance stops improving, and then retire (or are forced to retire) as a result. 

    While our results alone can’t distinguish between these possibilities, it seems likely that some combination of them are responsible. Regardless, we believe including serious post-World Cup racing in our analysis allows us to gain valuable insight into the effects of age on performance and supports our conclusion of a peak age around 32. It is also important to reiterate that there are athletes for whom the trend is not representative in the first place.  Nothing about our analysis suggests the inevitability of career decline by the age of 32.
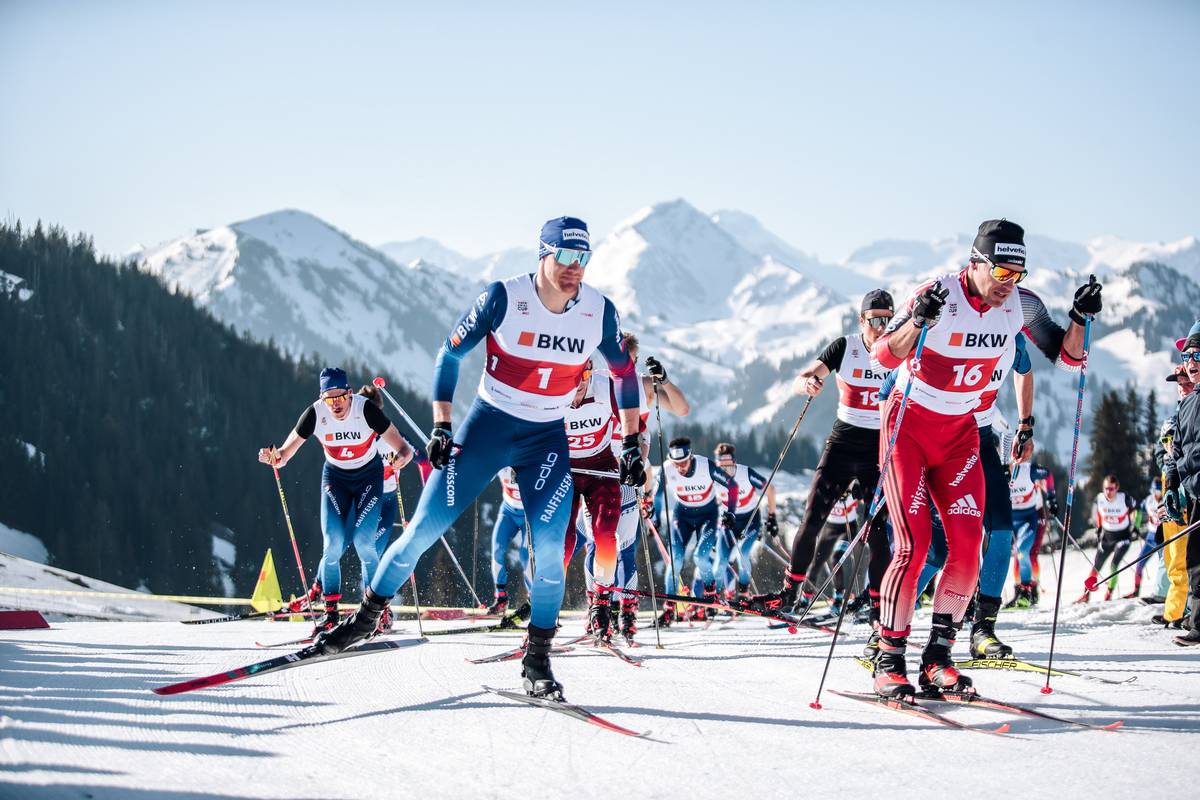
    The decorated Dario Cologna and his Swiss national teammate Jovian Hediger race the Pro Race Sparenmoos in Zweisimmen, SUI, part of the Swiss Championships, following their retirement from the World Cup in March, 2022 at ages 36 and 31, respectively. (Photo: NordicFocus)

    These results do seem to partially explain the discrepancy between our analysis and Elias’, but isolating the World Cup portion of their careers does not fully eliminate the trend of skiers eventually slowing down.  The graph is still “u-shaped.”  It appears that a reason for this is that the landscape of professional skiing has changed since the initial 2010 analysis.  Additional comparison of data before and after 2010 indicates that the phenomenon of points swinging upward with age is a relatively recent one, in part the result of a growing number of skiers continuing to race very seriously at older ages.  In other words, the effects of attrition have become less prominent since 2010 because there is simply less attrition. 

    Perhaps the more interesting question here is, what circumstances and structures have allowed this subset of skiers to race at such a high level for so long, while the majority of elite skiers have far, far shorter careers?  It may be worth asking how many people are forced to quit before their potential has been reached because they lack opportunities and support.  Prior to 2010, individuals over the age of 40 only made up 0.4% of total FIS license holders.  In the period since then, that proportion has more than doubled and there are over five times the total number of license holders over 40.  Athletes who are deemed too old to present the shimmering possibility of medals and crystal globes may not be getting as many resources, but they are showing up to train and race in increasingly high numbers anyway.  There are, after all, reasons to race besides winning medals.

    Ella DeWolf graduated from the University of Wyoming with her BS in molecular and microbiology and MS in botany. She continues to coach and race while working as a data analyst for an environmental consulting firm.

    Andrew Siegel graduated from the University of Vermont in 2021 and is now at the University of Wyoming–coaching, racing, and pursuing an MFA in creative writing. 

    This research was made possible by the generous support of the non-profit SNOW (Skiers Nordic of Wyoming).  


  • Statistics, Start Times, and Snowstorms: The Women’s 10 k in Falun

    Statistics, Start Times, and Snowstorms: The Women’s 10 k in Falun

    Note: we owe a thank you to John Estle, who sent us an Excel spreadsheet looking at results from the 10 k freestyle race grouped by starting times, in bins of ten starters. We thought he was on to something, but that FIS points and the structure of the start list might play in as well. Thanks, John, for sending us down this rabbit hole.

    The results of Tuesday’s 10 k freestyle race at FIS Cross Country World Championships in Falun, Sweden, were surprising.

    It wasn’t strange that Charlotte Kalla won by 41 seconds. A winner the previous weekend in Östersund, the Swede was among the favorites to win, and certainly the favorite among her countrymen watching from the grandstand and lining the trails.

    But just who joined her on the podium was surprising. Jessie Diggins and Caitlin Gregg achieved their first World Championships individual podiums in finishing second and third. For Diggins, who has a team sprint gold medal from 2013 World Championships, it was not shocking; for Gregg, who hasn’t scored a World Cup point since finishing 30th in this event at the 2010 Olympics, it was.

    Besides the Americans’ strong showing – every U.S. woman placed in the top 15 – the other surprise was Norway’s weakness. The top Norwegian finisher was Heidi Weng in 22nd place. It was in sharp contast to World Cup competitions all season, where Norwegians have usually won and not infrequently swept the podium.

    A snowstorm which rolled in as the individual-start race continued certainly complicated the results. Late starters were at a disadvantage, so it is easy to say that early starters like Gregg, who wore bib 3, got lucky. But was start time the main explanation for results? We set out to use statistics to answer this question.

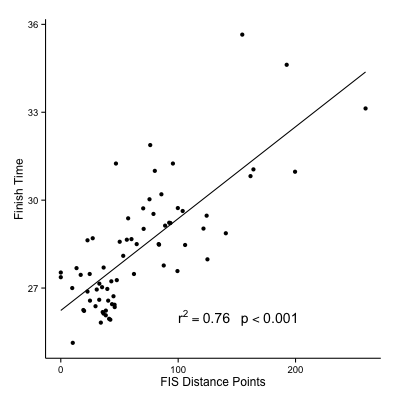
    First, we asked what provides a better correlation for race time: FIS Distance points, or start time (in minutes after the first starter)? When we do correlation tests, both factors provide significant correlations to race time, but FIS points provide a far better explanation, with 76% of the variance in race time explained as opposed to 41% by the start time.

    Whole fieldSo, the snowstorm did not disrupt the race so much that the historically “better” skiers could not beat the historically “worse” skiers. At almost every point along the FIS points axis, there were skiers who had a wide variety of race times, but in general, the racers with lower points had better results.

    And in fact, the racers with the lowest points had a smaller variance in their finishing times. Therese Johaug and Marit Bjørgen of Norway, with the lowest FIS points (zero!), finished just over two minutes behind Kalla. But racers with 80 to 90 FIS points had range of four or five minutes between their various finishing times, and that’s in relation to each other, not even in relation to Kalla.

    So why, if FIS points could predict pretty well where racers would finish, is our first reaction to the results to be so surprised? It’s individual results, like Gregg finishing third or Bjørgen finishing 31st, that got us. Let’s look a bit more at those results in context, by putting some names onto the points on the graph.

    To understand the results better, it’s important to look at the start list. It can be divided into three blocks: an initial unseeded block of five; then, a long block where unseeded skiers alternate with seeded skiers, each of these groups being seeded in reverse order with the highest-ranked skiers wearing the highest bib numbers; and finally, a block of six skiers with very unfavorable FIS points who were selected in a special qualification race on day one of World Championships.

    To look at how seeded versus unseeded skiers raced, we split the dataset into two and made simple linear models including both start time and FIS points. We’ll set the model up with an interaction factor: is there some emergent result of combining FIS points and start time? Do skiers with high FIS points struggle more as start time advances, or vice versa? This sort of interaction might explain some of why we find the results so interesting.

    (A statistical note: this isn’t actually statistically a good model, because FIS points and start time are highly correlated: the skiers’ start times are seeded according to ranking. However, the variation in the two factors is very different. While start time increases by half a minute with every bib, the distribution of FIS points is much more irregular, with clumps and gaps – thus if it does explain finishing time, it might do so in a different way. This is interesting, so we’ll break a few rules and put both factors in a model together, which will also allow us to see whether they interact.)

    For the unseeded skiers, including Gregg, we find that both FIS points and start time are significant factors explaining finishing time.

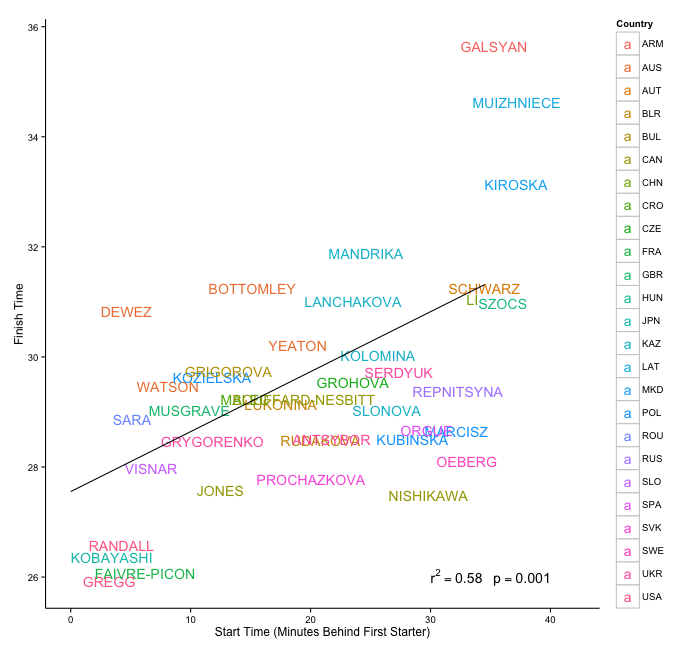
    First, look at the relationship to start time.

    Start unseededIt’s pretty good, although there are definitely plenty of skiers with later start times who still had good results: Alena Prochazkova of Slovakia, Jennie Öberg, and Perianne Jones and, in particular, Emily Nishikawa of Canada, pop out.

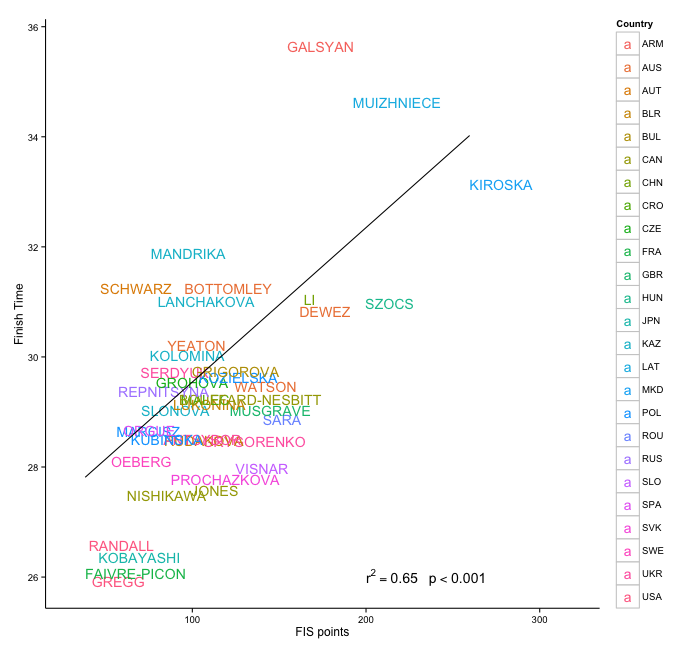
    Then, look at the relationship to FIS points.

    FIS points unseededThe left end of the regression line – the one driven by Caitlin Gregg, Kikkan Randall, Anouk Faivre Picon (who earned a best-ever finish by a French woman at a World Championships) and Yuki Kobayashi (who contributed to an amazing day by Japan with two women in the top 11) – is drawn by the early starters.

    And it reveals something important: yes, the first group of five unseeded skiers turned in strong results for being unseeded. However, they also had the lowest FIS points of any of the other unseeded skiers. Among all the unseeded athletes, they would still be expected to do the best on a day where start time didn’t matter, and if anyone were to shock the field by getting on the podium, they would be the best candidates.

    There’s no significant interaction in our model between FIS points and start time. So a skier’s points profile predicts their performance in one way, their start time predicts their performance in another way, and there is no effect of one factor on the other.

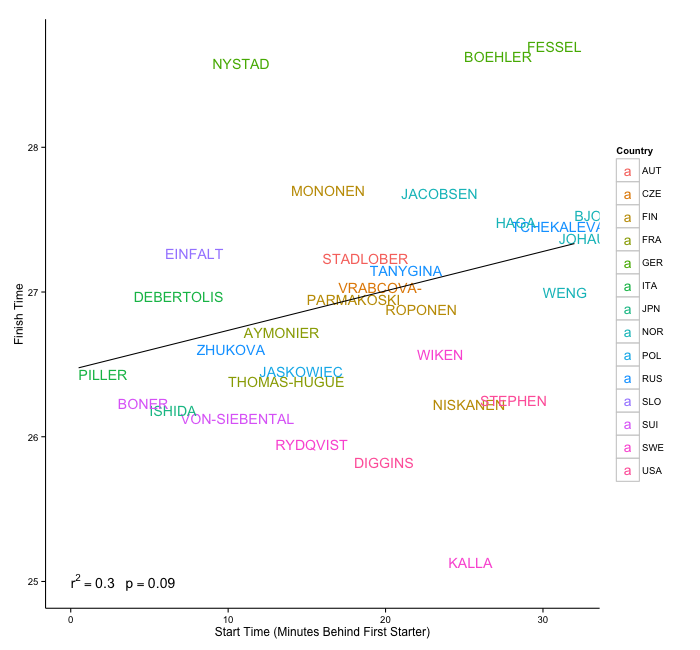
    That’s also true in the seeded group. Interestingly, however, not only is there no interaction, but start time is a much better predictor of a skier’s finish, the opposite of what we found from the unseeded group. The correlation between FIS points and race time is not significant, and its slope is close to zero: basically, a horizontal line through a cloud of data. Start time is not nearly as good a predictor as either factor was for the unseeded skiers, but it does explain something.

    seeded startThe most interesting thing to look at in this graph is how performances fall by teams. If you consider the black regression line to be the mean effect of start time on performance – the amount that the snow slowed skiers down as the race went on – then some teams fall mostly below the line (better than expected race times) and some fall mostly above the line (worse than expected race times).

    Sweden and the U.S. have the best, most unexpected outcomes, with Kalla and Rydqvist for Sweden and Diggins and Stephen for the U.S. racing incredibly well regardless of their start times.

    And while Norway made much of their waxing disaster, it’s actually Germany who perhaps did the worst: Nystad, Boehler, and Fessel all had very poor results, the slowest times of the entire seeded group.

    The Russians must have had about average skis, because Zhukova, Tanygina, and Tchekalova all fall almost exactly on the line where their performance would be predicted based on their start time.

    On the contrary, the Finnish women were all over the place: they had similar start times, but Mononen had a poor race while Niskanen excelled, and Parmakoski and Roponen fell somewhere in the middle.

    The takeaway? Two big teams missed the wax, but aside from that, skiers did pretty much as would have been expected by their previous results and the deteriorating conditions. While the U.S. is expected to thank luck for putting Gregg and Randall in bibs three and four, they should thank their wax team even more, because American skiers excelled throughout the field and did even better than should have been expected based on their start times.

    They can still covet Sweden’s wax truck if they want, though.

  • A Few End Of The Year Numbers

    Just to follow up on a few tweets over the weekend…

    Skiers from 10 different nations had podium results in men’s events, and only women from 7 different nations did the same.

    The nations with the most podiums are in stark contrast. For both the men and women, you of course have Norway in the lead. They had 9 different men reach the podium 32 times, and 7 different women reach the podium 67 (!) times.

    Behind Norway you have Switzerland (tied with Russia) each with 20 men’s podiums. But “the Swiss men’s team” is actually just Dario Cologna, one guy. Similarly, the second most women’s podiums went to Poland, i.e. Justyna Kowalczyk.

    Interestingly, the numbers for biathlon are a bit different. There, 8 different nations had podium winners in men’s events, and 11 different nations for the women. Amazingly, none of the women’s teams had more than 2 different women with podium results. For the men, the Russians had 6, while the Germans and Norwegians each had 3. (Granted, I think the biathlon schedule has fewer starts in it, though I could be wrong.)

    The season isn’t quite over, but across every FIS race I collected so far this season, Justyna Kowalczyk is leading with the most number of starts (including stage races) with 42. Of the ten with the most starts, 8 are women. The two men are Devon Kershaw and Alex Harvey. (Obviously, this is a silly statistic, because there are tons of races that are not FIS sanctioned. But we’re allowed to be silly every now and then.)

    The largest FIS penalty this season was 211.20. (The largest I have recorded is 246.40). The largest FIS points earned this season was 2643.82.

    Related posts:

    1. <Measuring Competitiveness Using Churn
    2. <Battle Of The Sexes
    3. <Week In Review: Friday Feb 18th


  • Kershaw’s Volatility

    A regular reader asked me over the weekend to comment on Devon Kershaw’s less than stellar opening race of the season. Specifically, he asked:

     Kershaw seems like he’s one of the most volatile skiers on the WC circuit. Is this true?

    The question of how consistent (or not) various skiers are comes up fairly regularly. I think I’ve done posts on a similar topic looking at Kris Freeman. I confess that I’ve become a bit jaded on this question, since I have generally come to believe that all skiers are less consistent than people tend to think. I think we all have a general tendency to overestimate how consistent ski racers are.

    It’s still an interesting question, though. I’m going to side-step it slightly and address a related concept, variability. So the following plot shows how variable Kershaw’s results have been for each season, relative to the men’s WC field. I’ve filtered this down so as to only use skiers with a reasonable number of starts per season.

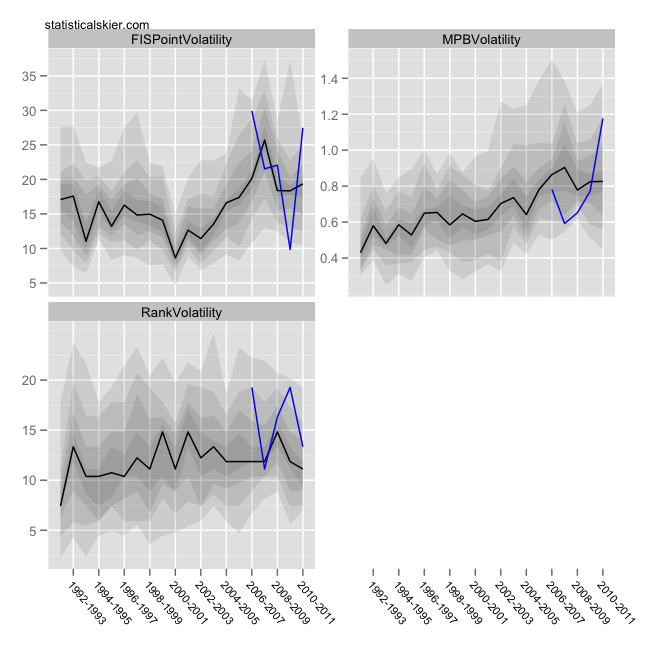
    There are three panels, one for each potential performance measure. The y axis measures how variable a skier’s results were over the course of that season. The Rank panel isn’t very useful, since that performance measure is too dependent on the size of the field. So instead let’s just focus on FIS points and MPB (percent behind the median skier). The blue corresponds to Kershaw while the black line shows the ‘typical’ level of variability for the men’s WC field, with the shaded areas giving a sense of the distribution across skiers.

    Both FIS points and MPB seem to suggest that last season was an unpredictable one for Kershaw. Recall that both he and Harvey tired noticeably toward the end of the season, which accounts for much of the variability. Before then, though, both measures generally suggest a skier who’s results are as variable, or less, than average.

    Of course, variability isn’t necessarily the same as volatility. But now we’re delving into murkier territory. What exactly are volatile results? Consider three skiers with the following sequences of FIS points:

    1. 1.01, 5.23, 1.01
    2. 20.11, 25.64, 19.44
    3. 10.12, 52.33, 11.22
    Which of those sequences is more ‘volatile’? Maybe we’d argue for (3), but proportionally it’s about the same as (1). Is a change of 5 FIS points the same whether you’re starting at the top of the pack or from the middle? Is doubling your FIS points an equivalent change regardless of whether you’re starting at the top or near the middle?
    I don’t have any easy answers for this, but it’s something to think about. I’ll ponder some more specific tools for measuring volatility and get back to you…

    Related posts:

    1. <Variability In World Cup Ski Racers
    2. <Week In Review: Friday Oct 8th
    3. <Biathlon and Cross Country Volatility Trends


  • Female Long Distance Specialists

    Since we supposedly do statistics around here, the goal here will be to ‘statistically’ identify folks who specialize in longer distance races. By that I mean people who tend to ski better (relative to their own performance) in longer races. The fun part is to see whether the folks we single out match up with the people we would have thought of anyway. We’ll begin with the women.

    The mechanics of this will largely mirror how I’ve identified technique specialists in the past, using mixed effects models. These are extremely handy modeling tools when you want to compare athlete specific effects. If you’re familiar with linear regression models, you can imagine doing a regression analysis on all skiers that investigates the effect of race length on performance. What we’d end up measuring is the average effect across all skiers. That’s not terribly interesting, or meaningful. Mixed effect models allow us to estimate a separate parameter for each skier that (hopefully) captures the effect of race length on performance for each individual skier.

    Beyond that, I’ll spare you the nitty gritty, except to say that I included a handful of other variables in the model to attempt to control for some other differences in race types (technique, mass vs. interval, etc.).

    Out of all the women with a reasonable number of major international distance races (at least 10), these are the ones with who have performed ‘significantly’ better in longer races:

    The more negative the value, the stronger the preference for long races. One of the reasons I like this kind of analysis is that it doesn’t just pick out people who are good at long races; it picks out people who are better at long races than short races. This means you aren’t just picking out the fast folks over and over again. There are plenty of big names here, but also some folks who are not dominant WC skiers. I’ve never hear of Annmari Viljanmaa, for example.

    Therese Johaug floating to the top here probably isn’t a surprise, although it’s not like I’d count her out completely in a 5k. And I’m also not surprised to see three Italians here; they seem to excel at the longer stuff a lot of the time.

    Who are some folks at the opposite end of this list? Along with a lot of people I’ve never heard from you’d find the likes of Vesna Fabjan, Ida Ingermarsdotter, Astrid Oeyre Slind, Katrin Zeller, Wendy Wagner and Natalia Korosteleva, who would all apparently tend to do worse in longer races.

    Related posts:

    1. <Week In Review: Friday Oct 1st
    2. <Technique Preferences: Italy
    3. <Mid-Season Recap: North American Distance


  • Who’s Justyna’s Biggest Nemesis?

    Who’s Justyna’s Biggest Nemesis?

    Have you ever wanted to know how well-prepared World Cup rookies are? Or whether Axel Teichmann really is Petter Northug’s most frequent whipping-boy? Then check out FasterSkier contributor Joran Elias’s new website, StatisticalSkier.com, where he breaks down data that he has compiled from the International Ski Federation. He’s been updating frequently, so check it out for your statistics fix.