This article was made possible through the generous support of our voluntary subscribers. If you would like to see more articles like this one, please support FasterSkier with a voluntary subscription.

Over the last six days, I drove 1,000 miles down to Tucson and 1,000 miles back to visit Bob Treadwell, a teammate on the U.S. Ski Team in the mid-’70s, along with our friend Tim Caldwell, who most readers will know from his long run on the U.S. Ski Team from the 1972 Olympics in Sapporo through Sarajevo in 1984. We had some fun days reminiscing, telling lies, and remembering the old days.
Over 2,000 miles of driving gave me plenty of time to listen to podcasts, Andy Newell’s, FastTalk Labs, and The Science of Sport. Most were excellent: informative, thought-provoking, and occasionally challenging in a good way. I encourage anyone with time and curiosity to dig into some of these.
After dozens of hours listening to topics ranging from adaptive signaling pathways and Zone 2 training to periodization, “Norwegian” models, AI-driven coaching, and separating bro-science from real science, I was struck by how often what I heard aligned with how I already think about training and by where it pushed me to learn more. All good things. This piece is meant to follow up on my earlier article on holistic training and fill in some of the gaps.
The Zone 2 Confusion
There’s no shortage of discussion or misunderstanding about Zone 2 training. What’s often missing is a clear definition of the Zone 2 terminology. In one podcast, for example, the host and guest both discussed “Zone 2” but were talking about different intensities. The guest defined it as anchored at Lactate Threshold 1 (LT1) or Ventilatory Threshold 1 (VT1). The host used a “Norwegian” Zone 2 model that sits above LT1/VT1.
I use a similar system. My Zone 2 starts above about 72 % of max HR—mostly above LT1/VT1, so what we in skiing call Zone 1 often overlaps with what cyclists and runners call Zone 2. Understanding those nuances matters when listening to these discussions; otherwise, we end up talking past each other.
What Zone 2 Actually Does
Zone 2 is discussed as a magic zone, credited with everything from increasing mitochondrial number and function, capillary density, and free-fatty-acid oxidation to improving stroke volume, aerobic enzymes, and cardiac output. All of that is partly true. But all training intensities contribute to these adaptations, it’s just a matter of signal strength.
Science shows the molecular signaling for most of these outcomes (via PGC-1α, AMPK/p38, etc.) is strongest with high-intensity work. That’s why elite endurance athletes train such high volumes: the weaker adaptive signal from Zone 2 requires a large total load to produce meaningful change.
That also means juniors, with lower training volumes, won’t see the same aerobic response early on. Volume still matters, but high intensity shouldn’t dominate either. It needs to be precisely controlled and well separated from endurance work to allow recovery and adaptation.
The Real Value of Low Intensity
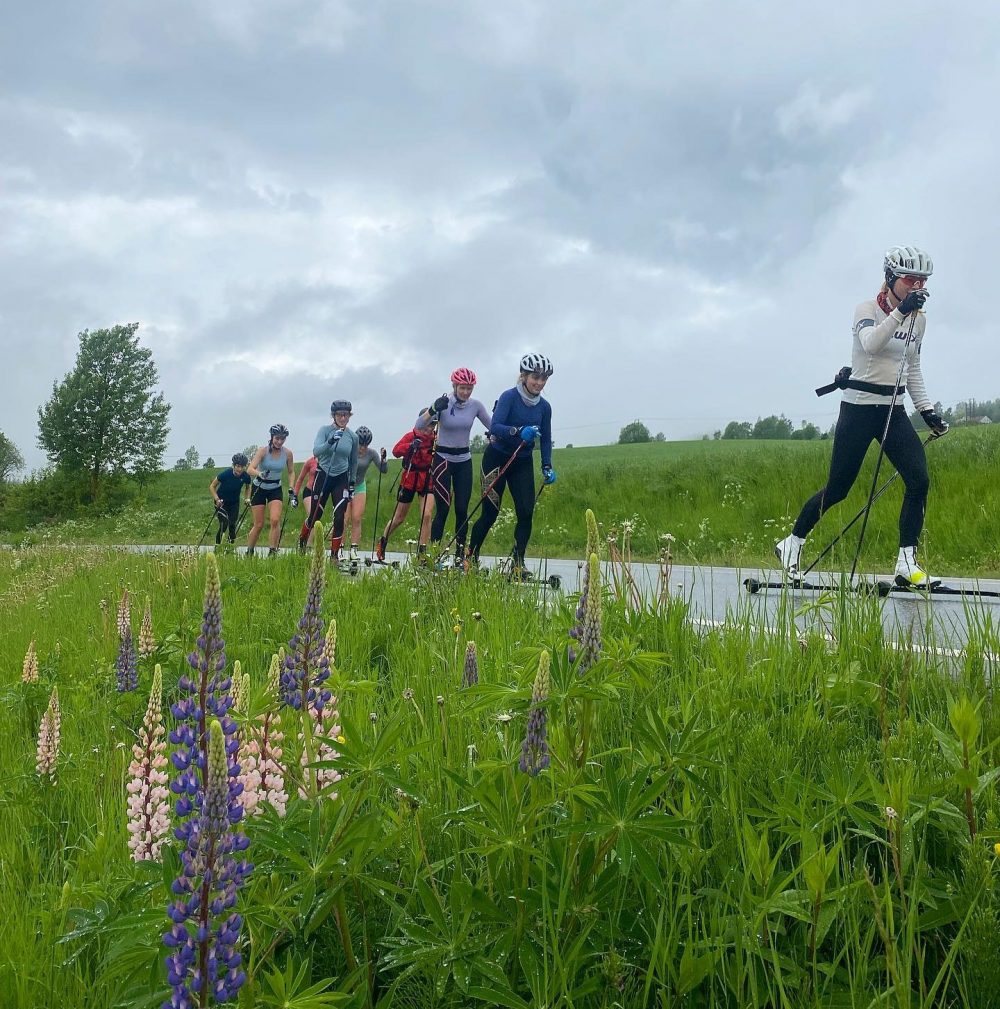
The growing focus on Zone 1–2 training in cross-country skiing is a good thing. It’s helped younger athletes learn how to train effectively and older skiers build higher volumes with lower risk of overtraining. I wish my generation had understood that paradigm.
The takeaway, all phases of the year should include a mix of low and high intensity. The large volume of low-intensity work builds the foundation, fatigue resistance, durability, neuromuscular coordination, and technique economy, that makes high-intensity work effective. As Stephen Seiler says, both low and high intensities belong in the program year-round. I couldn’t agree more. The way I think about it, the high intensity work improves the adaptive response to the low intensity training.
Threshold and High-Intensity Training
Threshold and “double threshold” training have become trendy topics lately. Many people, in my view, are copying successful athletes without understanding why it works for them.
A few key points:
- The higher the intensity, the stronger the adaptive response, but the dose and density must still allow recovery.
- Elite athletes often operate above 90 % of VO₂max. Years ago, mine was around 92 % with a VO₂max of 82–85 ml/kg/min. For athletes like that, threshold training often blurs into VO₂max work.
- Athletes with a low VO₂max need to raise that ceiling before threshold work will pay off. Those already high on both VO₂max and fractional utilization might get more from VO₂max or race-specific intensity instead.
The load of threshold training is also often underestimated. Jessie Diggins, in a FastTalk podcast, mentioned a session of 5 × 12 minutes at threshold. That’s roughly an EPOC ≈ 275 ml/kg and TRIMP ≈ 135, compared with a typical 30-minute VO₂max workout at EPOC ≈ 250 ml/kg and TRIMP ≈ 100. In real terms, threshold sessions are not necessarily lower stress or easier. Done excessively, they can be just as taxing.
Beyond energy systems, we also need to train skiing power (peak velocity), pacing ability, technical and tactical skills, and the ability to sustain race pace. Those elements should guide the interval prescription as much as the physiology.
For every athlete, we need to weigh the cost-benefit . . .
Jim Galanes
Testing and Control
For serious and older athletes, proper lab testing, measuring lactate and ventilation, is ideal to anchor training zones accurately.
For juniors and masters, I use a simpler field test: a six-minute effort, averaging HR over the final 3–4 minutes to anchor the top of Zone 4 (VO₂max). The bottom of that zone is about 5 % lower. From there, you can estimate the lower zones closely. I set the top of Zone 1 around 72 % HRmax.
It’s not perfect, but neither is lab testing, given measurement error and day-to-day variation. That’s why zones are ranges, not fixed points.
| EPOC PERFORMANCE TRAINING ZONES-Based on Max HR | 200 | |||||
| Training Zones | Percent of MHR | Heart Rate | Comments | La | ||
| Level 1 Aerobic Efficiency Training | 60% | 72% | 120 | 144 | Basic Endurance Work/if using lactate, the top of the Zone is LT1 | .8-1.5 |
| L2 | 72% | 82% | 144 | 164 | Cost more than it benefits | 1.5-2.5 |
| Level 3 | 82% | 87% | 164 | 174 | Maximal Steady State Used mainly for long race specific training and mature elite athletes | 2.5-4 |
| L4- VO2Max/Race Pace and Intervals | 87% | 92% | 174 | 184 | Top of Zone Confirmed by average HR in 6 mins test. Low to mid-Level 4 can be as much as 60-90 minutes race efforts for fit athletes. | 4-6 |
| L5-Maximal | 92% | 98% | 184 | 196 | Short Races < 6 mins, Very Hard Intervals | 6-10 |
This Coach’s Perspective
I typically reserve threshold-focused training for athletes who already have a relatively high VO₂max, high fractional utilization, and/or who are racing very long distances. There’s ample evidence that VO₂max-type training can also drive adaptations at threshold. In practical terms, 15–30 minutes of VO₂max work can produce a similar level of stress needed to stimulate adaptation.
Even in the best of cases, identifying VT2 or LT2 visually is problematic. The analogy I use is that trying to find that “corner” on a lactate or ventilation curve is like trying to find a corner in a circle, it’s often not there. After looking at years of lab and field tests, I’ve found that for most non-elite athletes, lactate and ventilation tend to rise in a relatively linear fashion, making any precise threshold point more of an estimate than a clear physiological marker.
For most non-elite athletes, the focus should be on one or two Zone 4 sessions per week. The key point is that heart rate alone does not create the stress necessary to improve VO₂max or velocity at VO₂max. What drives those adaptations is the muscle’s ability to produce higher power or speed outputs.
For juniors, masters, and athletes new to structured training, I recommend simplifying things into three zones during the early years:
- Endurance training – below LT1/VT1
- Moderate training – between LT1/VT1 and LT2/VT2
- Hard training – above LT2/VT2
This approach keeps training simple and helps athletes learn how to polarize their effort effectively without getting bogged down in unnecessary complexity.
Finally, the goal of all high-intensity training is to recruit more motor units and to increase the power or velocity an athlete can sustain over race durations. For every athlete, we need to weigh the cost-benefit: extensive threshold work is metabolically expensive relative to VO₂max training and should be programmed with that in mind.
Love Stories Like This? Help Keep Them Coming.
Feature interviews like this one take time, access, and care to produce. If you value thoughtful storytelling and independent ski journalism, please consider becoming a Voluntary Subscriber. Your support directly fuels the work we do to cover the people, places, and moments that make our sport special.
Join the FasterSkier community!