This article was made possible through the generous support of our voluntary subscribers. If you value coverage like this, please support FasterSkier with a voluntary subscription.
Over the last decade I have often thought that we need to find a better way to define training zones. I have assessed every model under the sun and even tried to create some new ones. From a metabolic perspective, three-zone models probably make the most sense, because physiological anchors form the transition points, even though some of those anchors, lactate threshold among them, are questionable. Then there are five- and seven-zone models. Which are best, and which are most accurate? The answer is probably none of them. They all have limitations, and there really is not a better method.
Some coaches set training zones from maximal heart rate. Others use lactate measures referenced to heart rate, pace or power, and still others use gas analysis (ventilation, VO2, RER and so on). Whatever the method, the important point is how the zones are used and implemented in training. While there may be a valid physiological basis for training zones, their primary use is to quantify training as planned and as performed. That is how we assess which methods of training have worked for the individual athlete.
Heart Rate Holds Up
Many coaches and even physiologists claim that heart rate is too variable to be used reliably for training control. Of course it is variable. Physiology varies daily with fatigue, recovery, hydration, glycogen status and more. In my experience, heart rate is no more variable than any other metric we use. We just don’t recognize the variation in the others, because it is not practical to measure them every day. Human physiology is complex, and in general heart rate reflects the current status of an athlete’s physiology. Under any system, it is important to train at a level that reflects the individual’s physiology and condition on that day. Heart rate is as good as anything for that, and I would argue better, because the daily variation is easy to assess.
Heart rate is inexpensive, practical and physiologically informative. A higher heart rate at a standard workload can reflect warm weather, glycogen depletion or general fatigue, all of which matter when adjusting the day’s training. A lower heart rate at a standard workload often reflects improved fitness, though occasionally it can also reflect fatigue and increased parasympathetic drive of the autonomic nervous system.
Whose Zone 2?
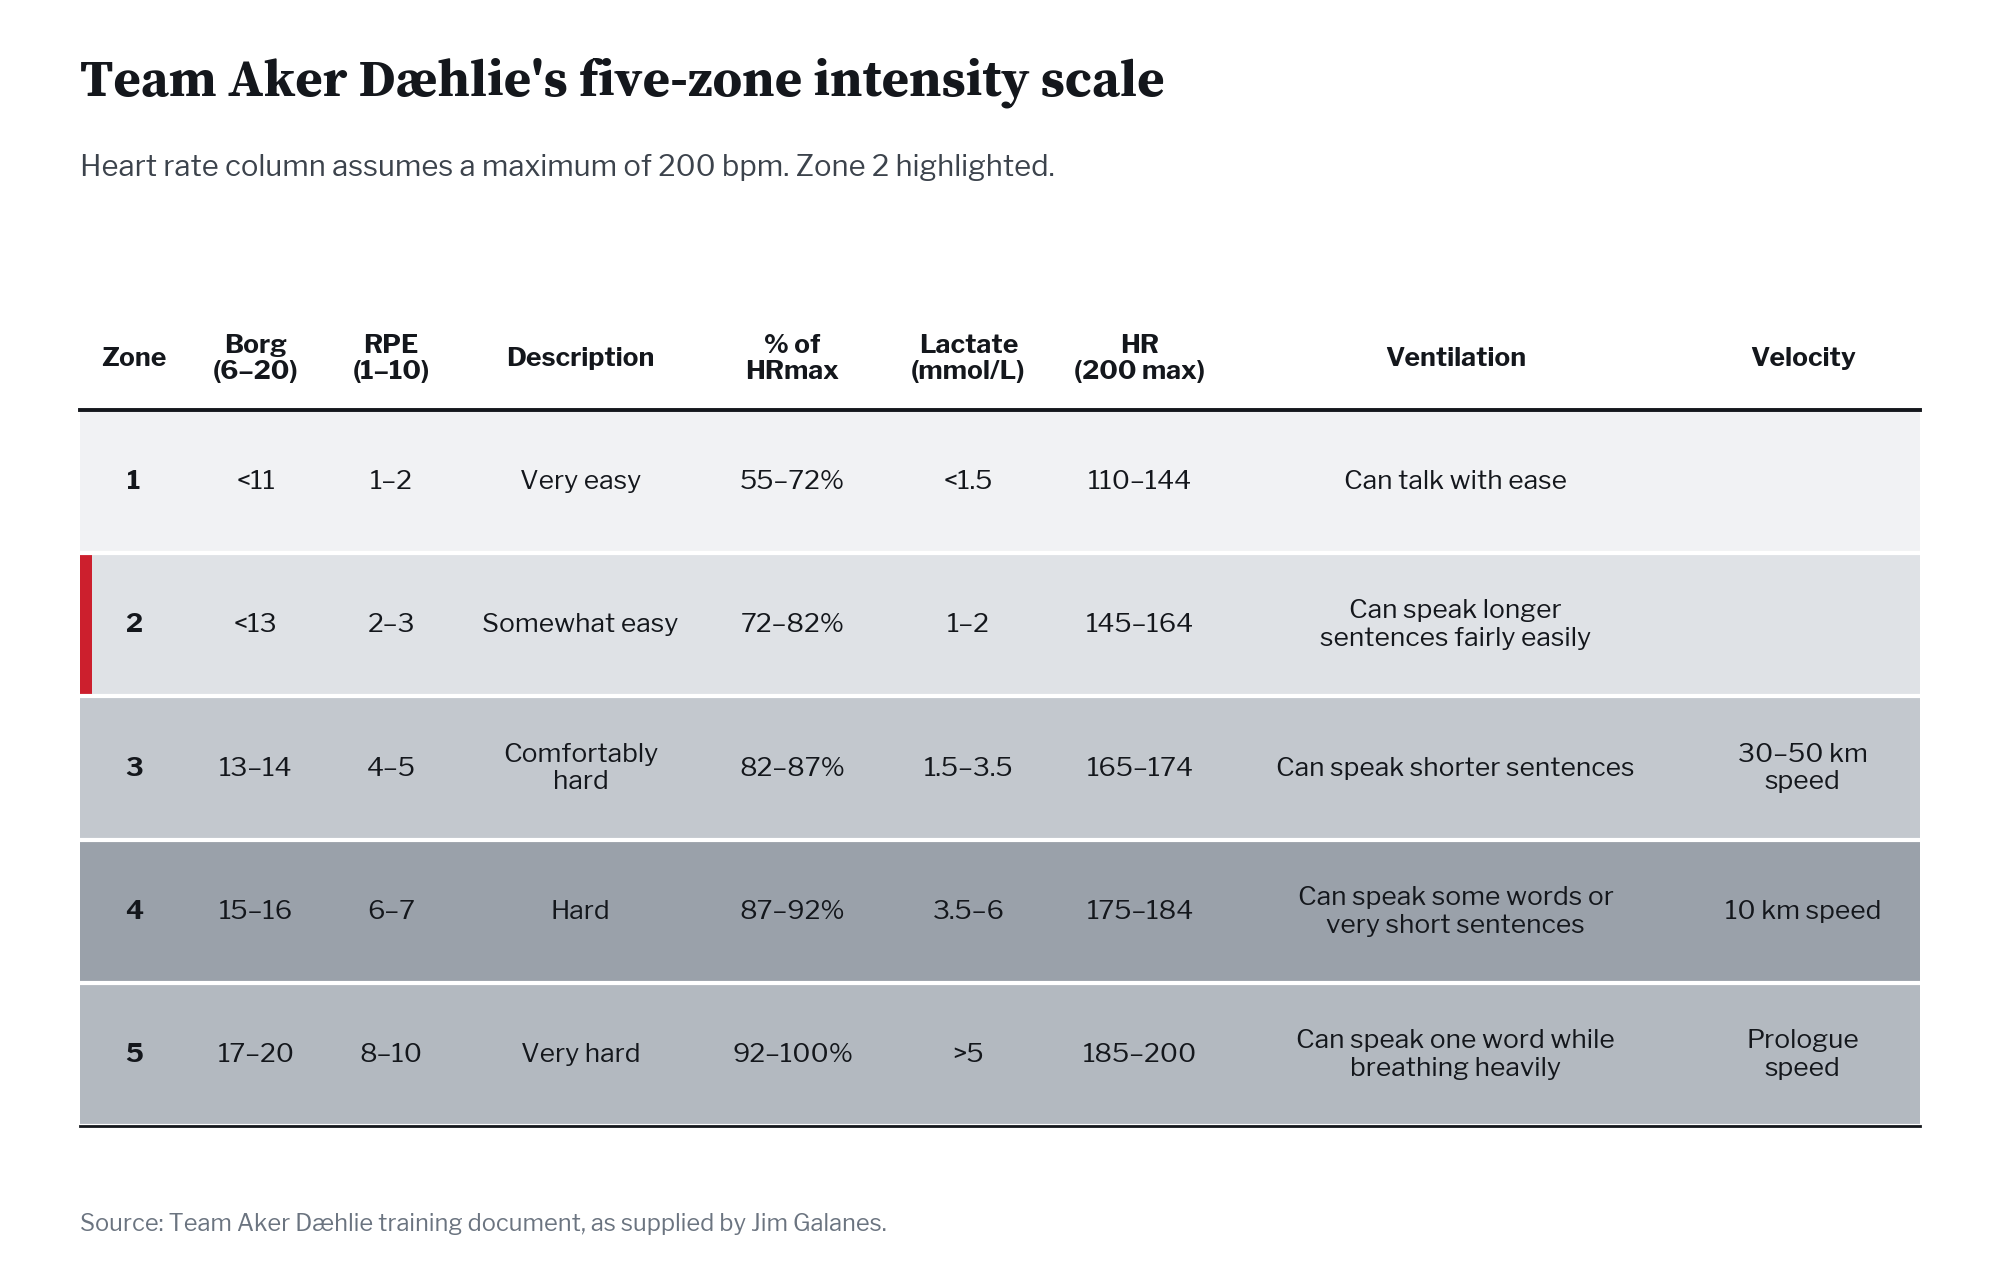
One example is a document published a few years ago by Team Aker Dæhlie in Norway, which laid out a slightly different training zone model than I was used to seeing out of Norway. Given the popularity of Zone 2 training, I believe it is important to understand how the proponents of a particular system of training define and use their zones.
In the Aker Dæhlie system there is significant overlap between Zones 1 and 2 in terms of lactate, with Zone 1 below 1.5 mmol/L and Zone 2 at 1 to 2 mmol/L, while the heart rate ranges are what I consider consistent with how most training zones are delineated. The implication of that lactate range is that lactate is highly variable and not the same between individuals. From the published document we can see that their Zone 2 does not fit what some may consider Zone 2. It fits how I would describe Zone 1: endurance training not to exceed 70 to 75 percent of maximal heart rate. We need to realize that lactate may vary greatly from day to day and can’t be viewed as a hard and fast anchor for a specific training zone.
Listening to many podcasts and reading many articles and publications, I hear people discuss training zones as if they were talking about the same thing. Most often they are not. The recent popularity of Zone 2 training is a good example: what Iñigo San Millán means by Zone 2, many of the common five-zone models would define as Zone 1.
So if you want to use and reference the Aker Dæhlie zone system, you should also be aware of this statement about Zone 2 in their published document:
Zone 2: Semi-hard long sessions with a heart rate at around 140-155 bpm and with lactate up to 2 mmol/L, is considered intensity 2 training. Scholars debate over the importance of this training. In our experience, this training costs more than it is worth, and should therefore not be prioritized. L2 can work well to learn/automate correct technique. Again, evaluate cost vs benefit! Typical length of a session is 1 to 3 hours of continuous activity.
Zones 3, 4 and 5 are close to how many would describe training in those ranges, although Zone 3 here may sit a bit lower than it is often described. But the Aker Dæhlie team is primarily a long-distance team, and we don’t know whether they use different zone ranges for World Cup skiers, or whether World Cup skiers do more of their intensive training in Zone 4.
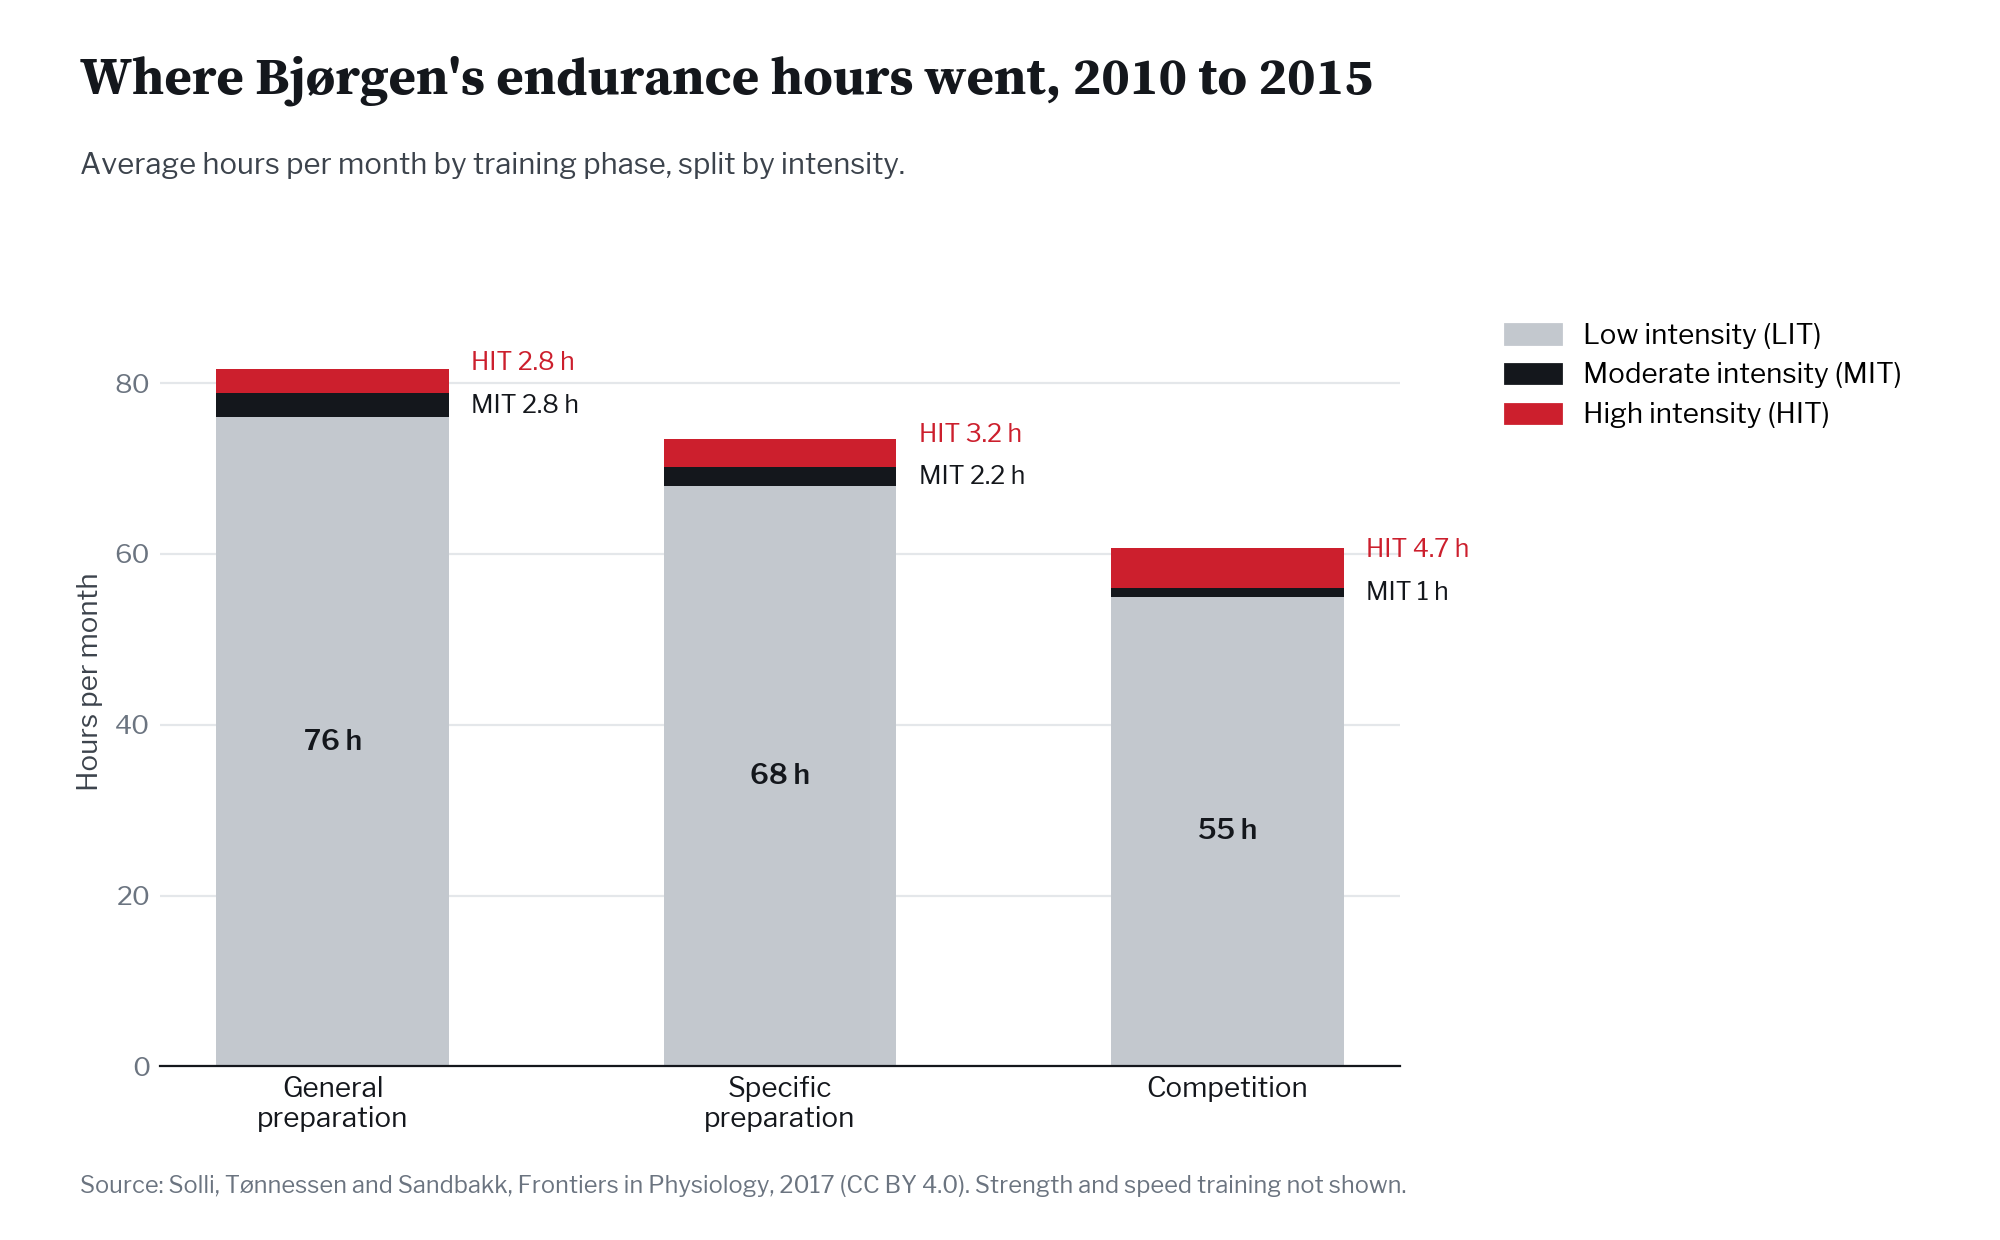
How Bjørgen Trained
A chart like the one above is often used to illustrate how one of the best female cross-country skiers ever trained during her most successful years. The data comes from an extensive study of Marit Bjørgen’s training.
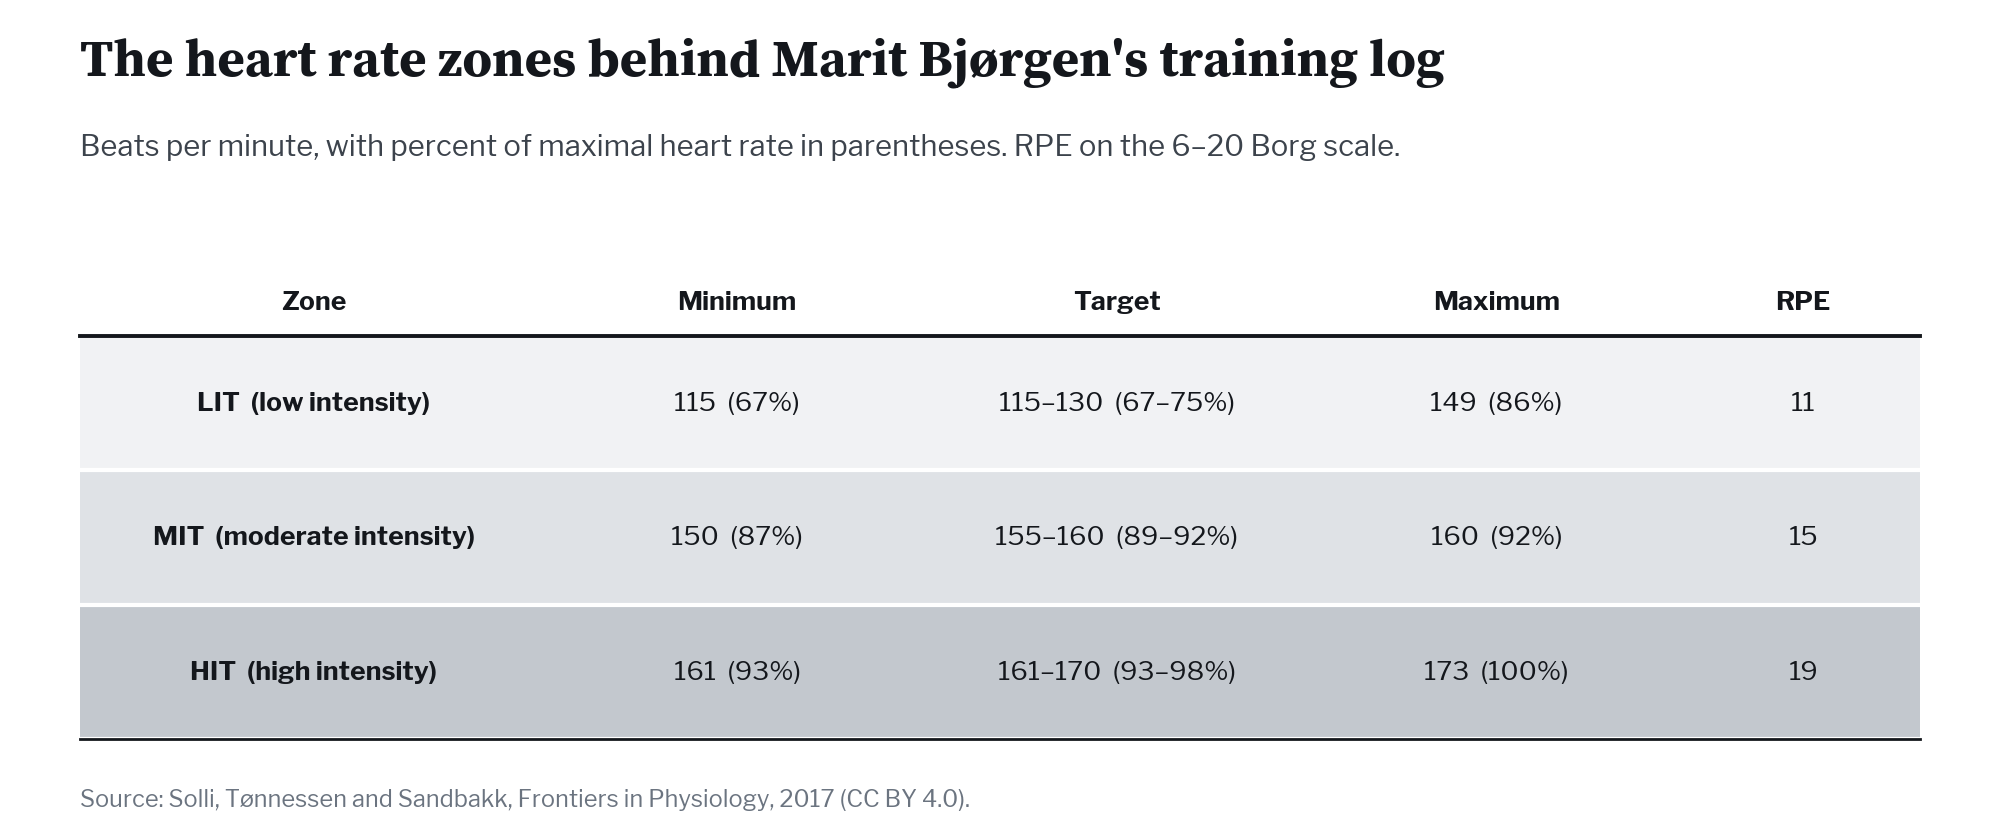
A 25-Beat Gap
To provide context, these are the zones used to define this athlete’s low-intensity (LIT), moderate-intensity (MIT) and high-intensity (HIT) training. The low-intensity target is where we might expect it, at 67 to 75 percent of maximal heart rate. However, there is a large gap, some 25 beats per minute, between the low- and moderate-intensity targets, with the MIT target at 89 to 92 percent of maximal heart rate. That MIT zone is quite different from what is described in the Aker Dæhlie document.
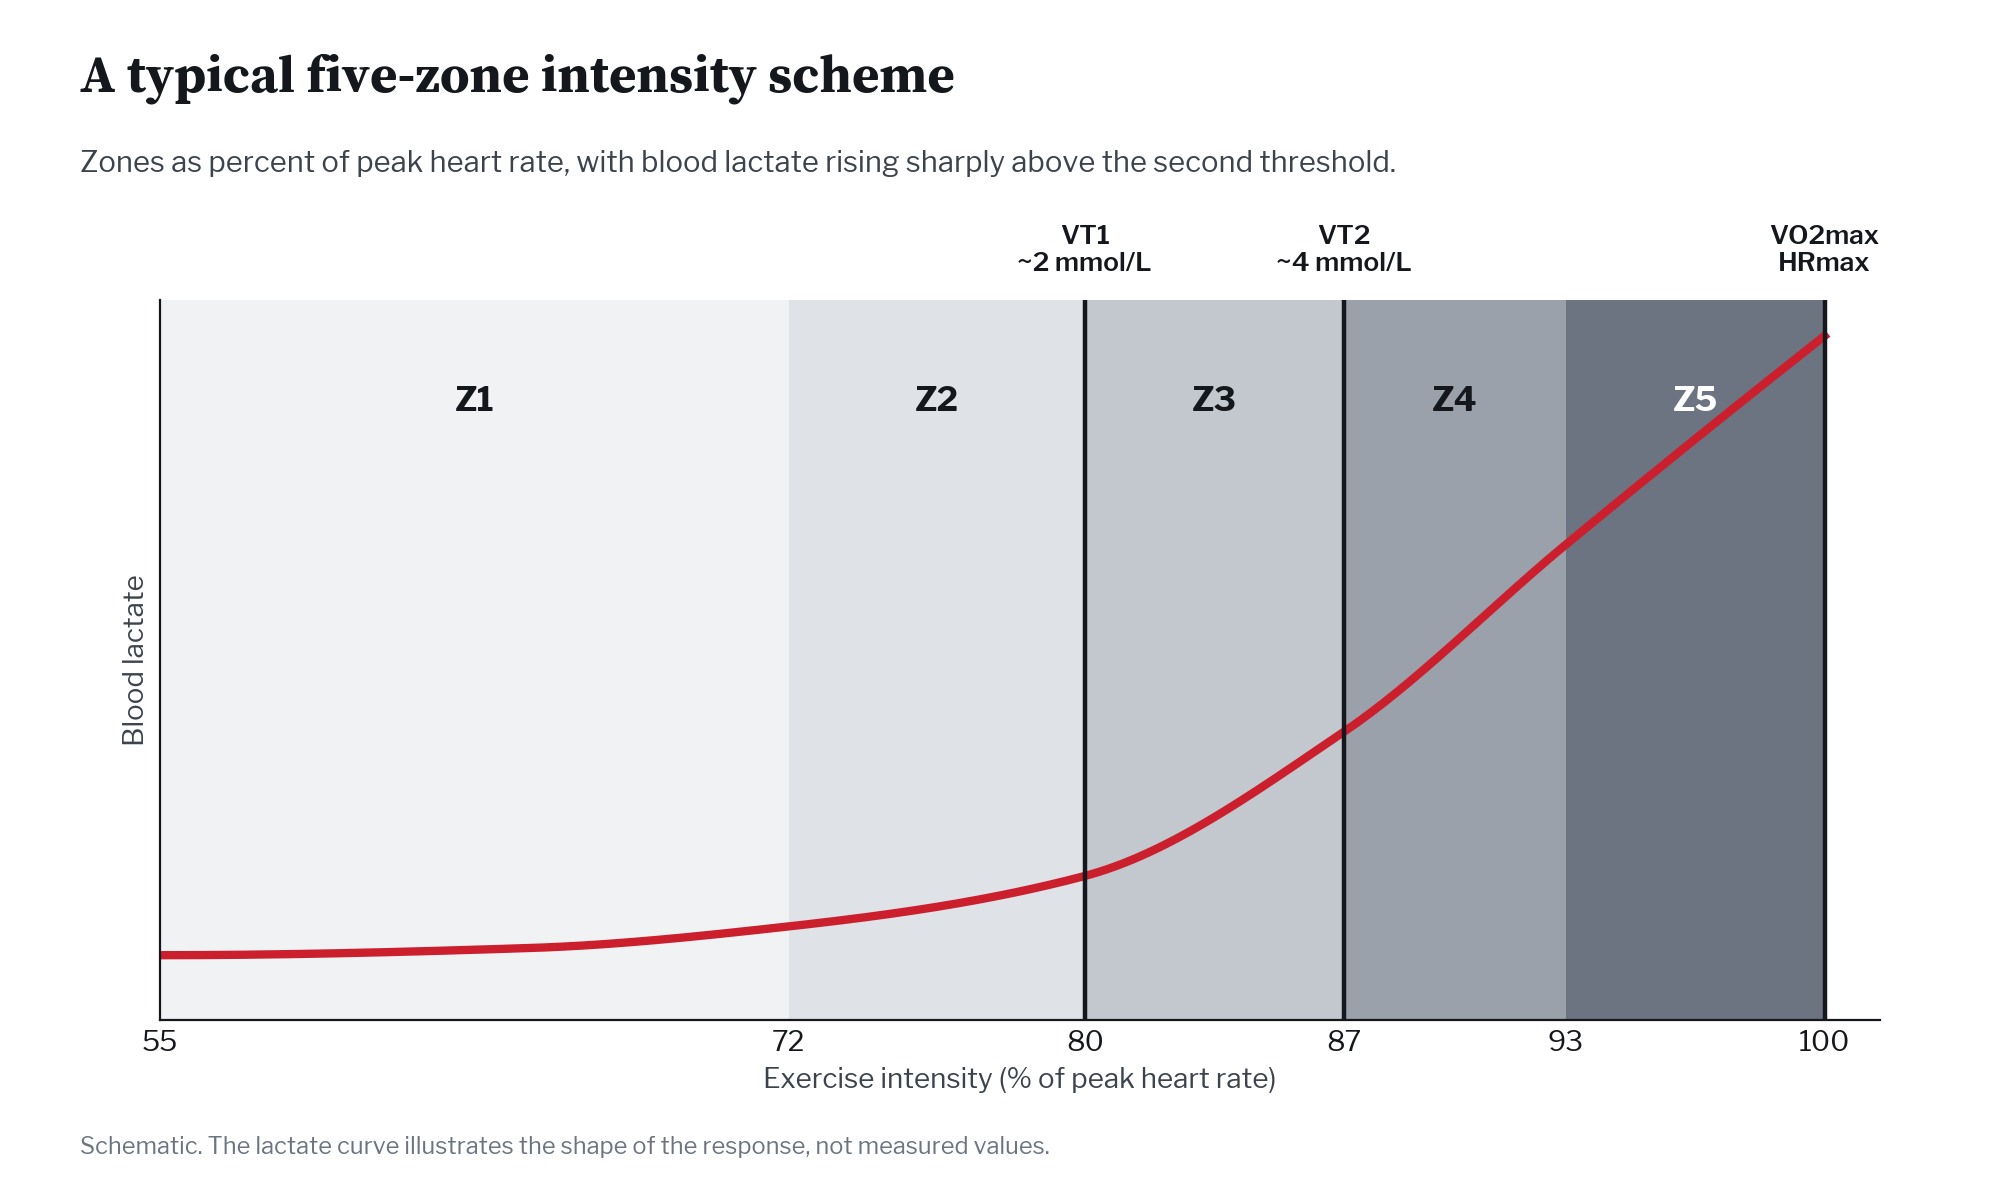
Another Common Model
Here is another example, much like the zone table published by Aker Dæhlie. It is a good theoretical model, but again I would suggest that endurance training above 75 percent of maximal heart rate is unnecessary, and the cost-benefit assessment does not suggest a benefit. We also see that LT1/VT1 is probably not at 80 percent of maximal heart rate for most athletes.
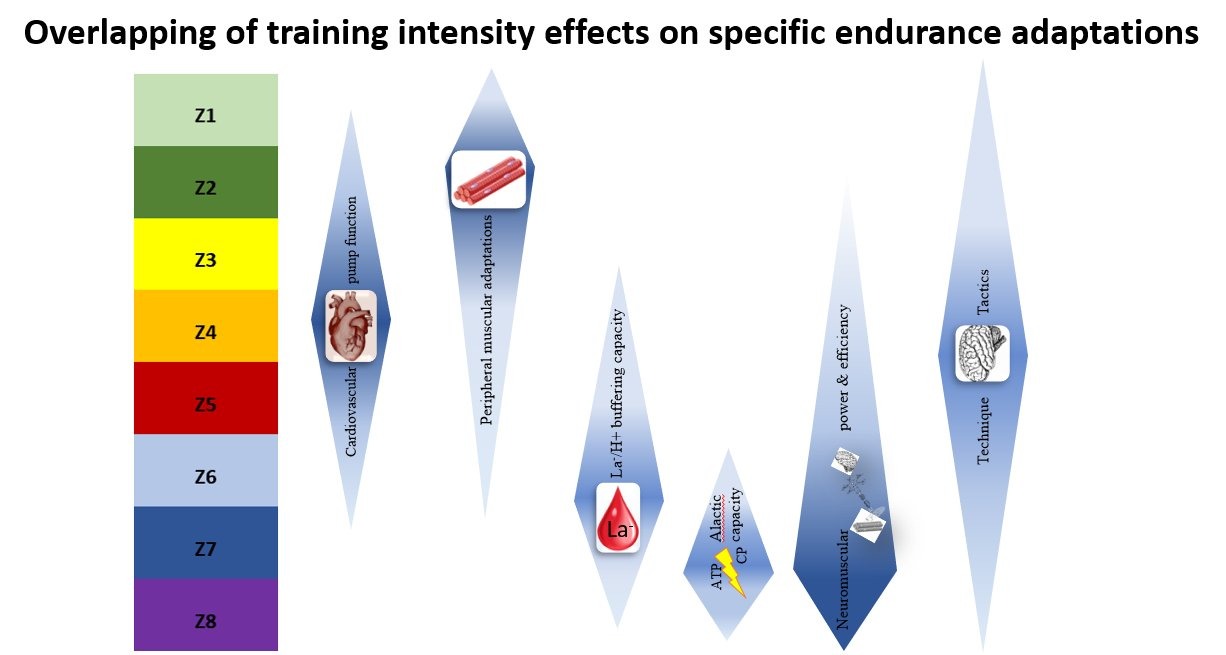
Zones Overlap
Most of us consider training zones hard and fast, but that is not the case. The chart above illustrates the possible range of metabolic and neuromuscular benefits of different training intensities. I believe the reason to use zones and monitor training is to ensure effective training adaptation. That is why I say that endurance training at more than 70 to 75 percent of maximal heart rate does not have a positive cost-benefit. As recovery time increases, adaptation slows, and the time to readiness for the next hard session can be extended.
The chart is an excellent depiction of how adaptations overlap across training intensities. Each metabolic and neuromuscular adaptation has a theoretical optimal range, but the adaptations still occur well outside those ranges.

My Advice
- When analyzing what others say or publish, look closely and question what their training zones are based on. You must be speaking the same language before implementing any changes.
- Pick a training zone model that makes sense to you. If you are going to use lactate, you must do frequent spot checks so you understand your individual daily variation. You absolutely cannot rely on a one-off test to make training decisions.
- Use new and emerging technology, such as respiration and muscle oxygen monitoring, only after validating its consistency and variability.
- Don’t jump from trend to trend. There are a lot of them out there. Learn from what has worked, and weigh emerging science against experience. Remaining current does not mean trend-hopping to stay relevant on social media.
- Be clear on terminology. The same term can mean very different things to different scientists and coaches.
- Use a couple of tests that produce meaningful data and inform training decisions. Collecting more data does not make for better programs.
- For most people, perhaps everyone, percentage of maximal heart rate is a practical way to determine training zones.
Help Support Our Coverage!
If you value the thoughtful work and access FasterSkier provides, please consider becoming a Voluntary Subscriber. Your support directly fuels our work to cover the people, places, and moments that make our sport special.
Join the FasterSkier community!
Leave a Reply
You must be logged in to post a comment.